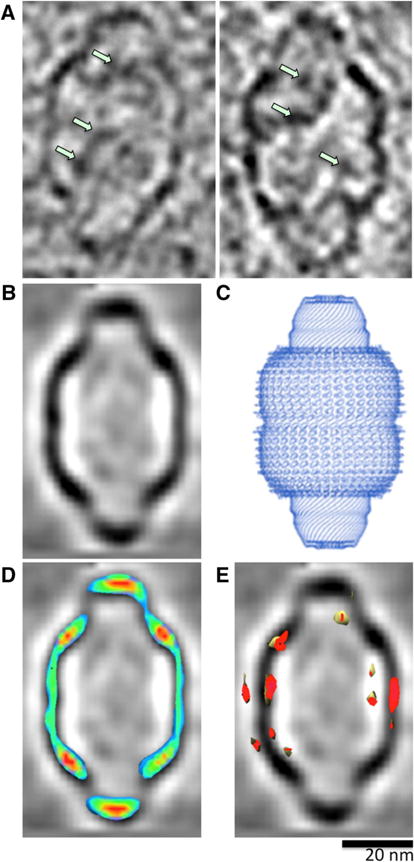
Fig. 3.

Intracellular vault ultrastructure. a Intracellular vaults demonstrate discreet internal densities (green arrows). b Subtomogram average of intracellular vault particles. c Crystal structure of purified rat liver vaults [9]. d Overlay of density heat map with averaged volume; areas of highest electron density are red and low-density areas are green. e Overlay of variance map showing the areas of highest variability (red) localized to the particle’s waist region
