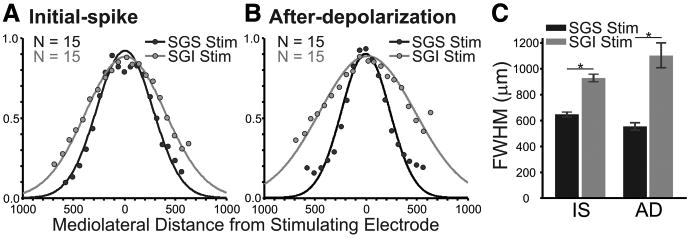
Figure 4.

The highest amplitude mediolateral spread appears in SGS following stimulation (Stim) in either SGS or SGI. A, Normalized signal amplitude [(ΔI/I)/maximum I] is plotted against mediolateral distance through the SGS from the site of the stimulation (zero distance) for the initial-spike (0–10 ms). Black points show the amplitude after SGS stimulation. Gray points show the amplitude following SGI stimulation. The curves are Gaussian functions that were fitted to the data points from each experiment (N = 15). B, After-depolarization data (20–160 ms) arranged as in A. C, The mean and SE of the FWHM calculated from the fits for the slices is plotted for initial-spike (IS) and after-depolarization (AD) data. Black bars are data from SGS stimulation. Gray bars are data from SGI stimulation. N = 15. *p < 0.05.
