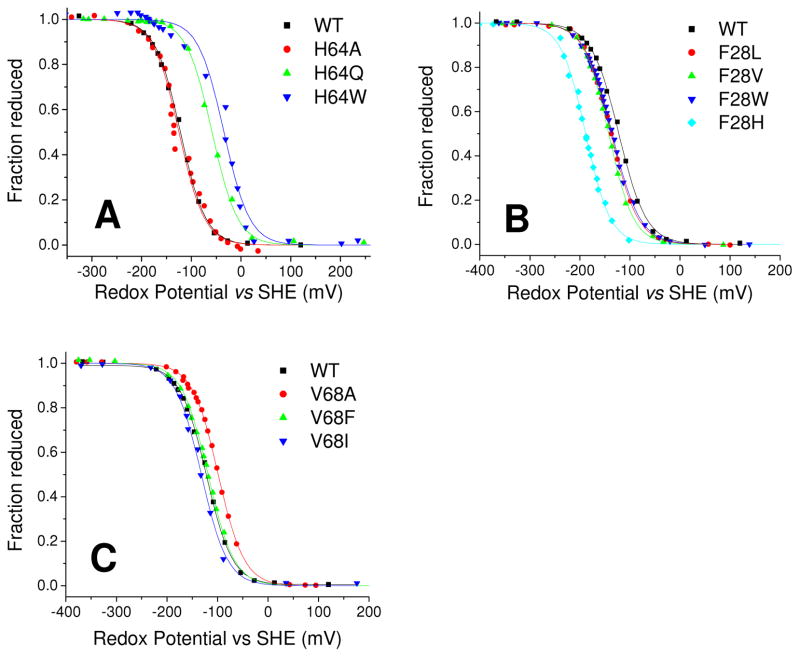
Figure 5. Redox potential determination for Ngb wild-type and mutants.
The plots show the fit of the fraction reduced (as determined from absorbance spectra) to the Nernst equation (solid lines). The titration of wild-type Ngb is included in all panels for reference. Panel A, His64 mutants; Panel B, Phe28 mutants; Panel C, Val68 mutants.

