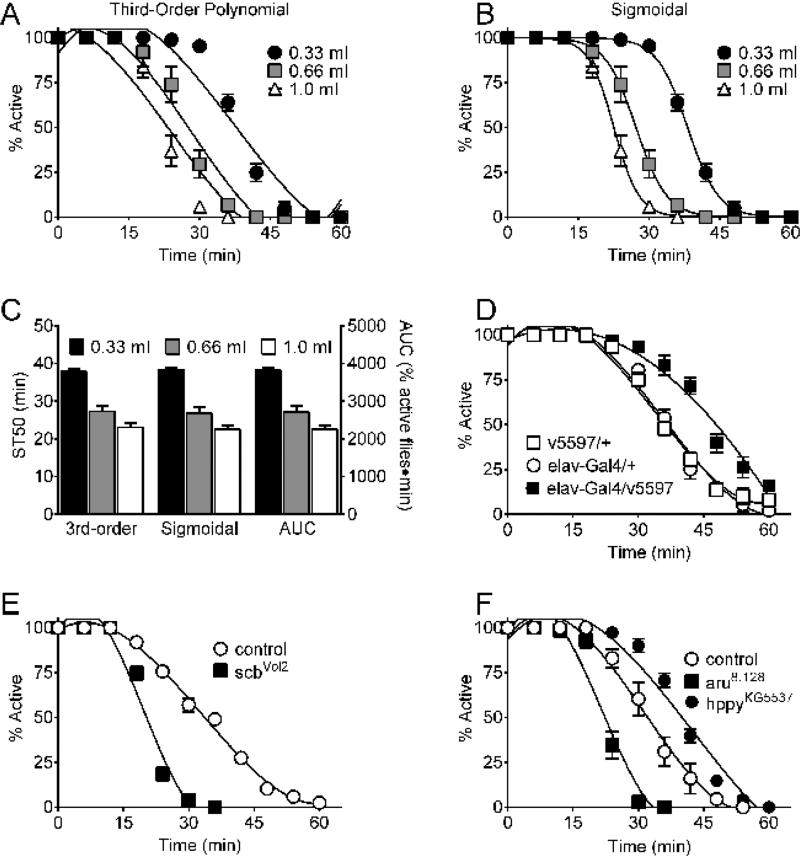
Figure 1. (A-C) Sedation assay data analysis options.
Control w[A] females (w1118 isogenic, Bloomington Indiana Drosophila Stock Center stock #5905) were exposed to vapor from the indicated volumes of 85% (vol/vol) ethanol. (A) Sedation time-course data fit with third-order polynomials. (B) Sedation time-course data fit with sigmoidal curves. (C) Ethanol sedation sensitivity quantitated as (left Y-axis) ST50 values interpolated from third-order polynomials and sigmoidal curves or (right Y-axis) area under the curve (AUC, % active flies x time). Ethanol volume, but not analysis method, impacted ethanol sensitivity (two-way ANOVA; effect of volume, p <0.0001; effect of analysis method, n.s.; n = 8/group; AUC data transformed 1/100 to account for the difference in magnitude of the values). (D-F) Representative time-course data from. (D) Expression of Cnx14D RNAi in the nervous system (elav-Gal4/v5597) blunted ethanol sensitivity relative to controls (v5597/+ and elav-Gal4/ +). (E and F) Mutation of scb (scbVol2) and aru (aru8.128) enhanced ethanol sedation sensitivity and mutation of hppy (hppyKG5537) blunted ethanol sedation sensitivity compared to controls. Data in E-F were previously reported as ST50 values 18.

