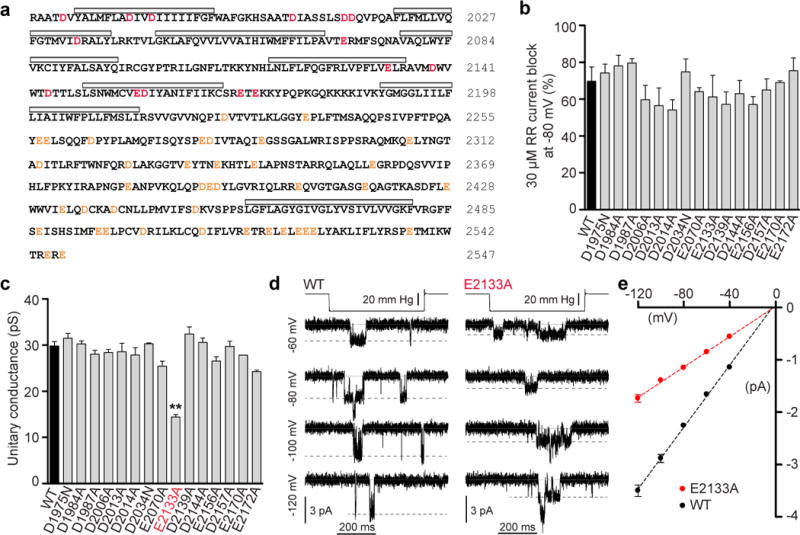
Figure 3. Neutralization of mPiezo1 acidic residues.

(a) Protein sequence of mPiezo1 C-terminal region beginning at residue 1971. Mutated acidic residues and other acidic residues are highlighted (red and orange, respectively). Grey bars indicate hydrophobic regions. (b) Average block of MA currents at -80 mV by 30 μM RR in cells transfected with mPiezo1 WT and specified mutants (n = 2–6, mean ± s.e.m.). (c) Unitary conductance of stretch-activated channels in cells transfected with WT mPiezo1 and specified mutants. Conductance is calculated from the slope of linear regression line of individual cell single-channel I-V relationships (n = 3–13, mean ± s.e.m.; One-way ANOVA with Dunn’s comparison to WT, **P<0.01). (d) Representative (from 13 and 5 experimental replicates) stretch-activated channel openings elicited at specified potentials from mPiezo1 WT and E2133A transfected cells. (e) Average I-V relationships of stretch-activated single channels in mPiezo1 WT and E2133A transfected cells (n = 13 and 5, respectively; mean ± s.e.m.). Single-channel amplitude was determined as the amplitude difference in Gaussian fits of full-trace histograms.
