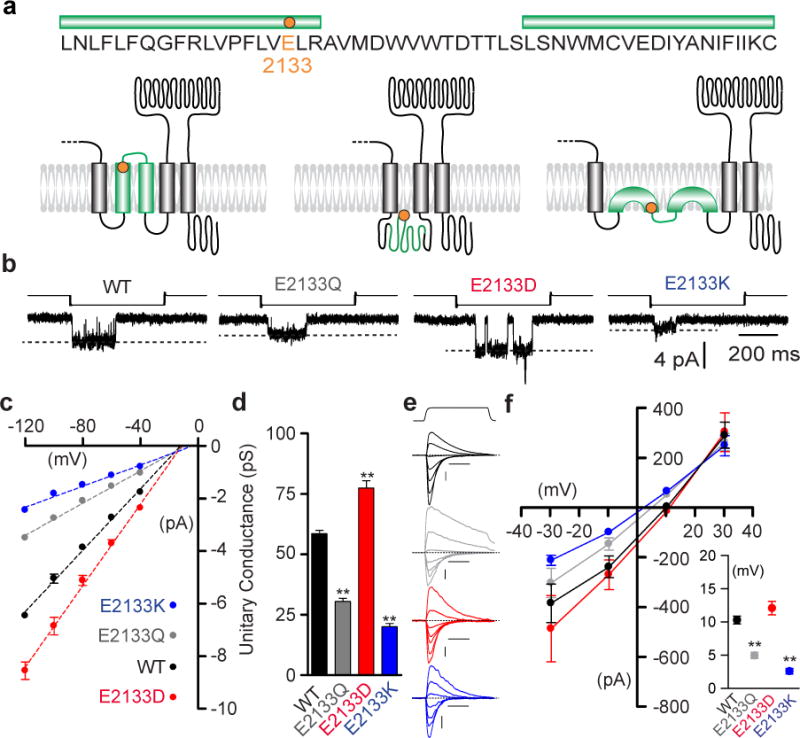
Figure 4. Mutations of a conserved Glutamate residue alter mPiezo1 pore properties.

(a) Protein sequence surrounding E2133 with putative topology models of mPiezo1 C-ter region. E2133 is highlighted (orange) and green bars indicate hydrophobic regions. (b) Representative (from 4–7 experimental replicates) stretch-activated channel openings at −80 mV from cells transfected with mPiezo1 WT, E2133Q, E2133D and E2133K. Stimulation intensities are −15, −10, −20 and −50 mm Hg, respectively. (c) Average I-V relationships of stretch-activated single channels in cells transfected with mPiezo1 WT, E2133Q, E2133D and E2133K (n = 7, 5, 5 and 4, respectively; mean ± s.e.m.). Single-channel amplitude was determined as the amplitude difference in Gaussian fits of full-trace histograms. (d) Unitary conductance calculated from the slope of linear regression line of individual cells (mean ± s.e.m.; One-way ANOVA with Dunn’s comparison to WT, **P<0.01). (e) Representative (from 6–9 experimental replicates) traces of MA currents recorded with 150 mM CsCl based intracellular solution and 100 mM CaCl2 extracellular solution from mPiezo1 WT (black), E2133Q (grey), E2133D (red) and E2133K (blue) transfected cells. Currents are elicited from -69.6 to +50.4 mV, Δ20 mV. Scale bars: 100 pA, 50 ms. Probe stimulation displacements are 3, 4, 6 and 7 μm, respectively. (f) Average I-V relationships of MA currents recorded from mPiezo1 WT, E2133Q, E2133D and E2133K expressing cells with 150 mM CsCl based intracellular solution and 100 mM CaCl2 extracellular solution (n = 8, 6, 6 and 9, respectively). Inset: Average reversal potentials from individual cells corresponding to panel (f) experiments (WT: 10.3 ± 0.6 mV; E2133Q: 5.0 ± 0.5 mV; E2133D: 12.1 ± 1.0 mV and E2133K: 2.6 ± 0.4 mV; mean ± s.e.m.; One-way ANOVA with Dunn’s comparison to WT, **P<0.01). Panels (b), (c) and (d) experiments were performed in cell-attached configuration with Na+ as the only permeating cation in the recording pipette.
