
Figure 5. RR sensitivity of E2133 mutants.
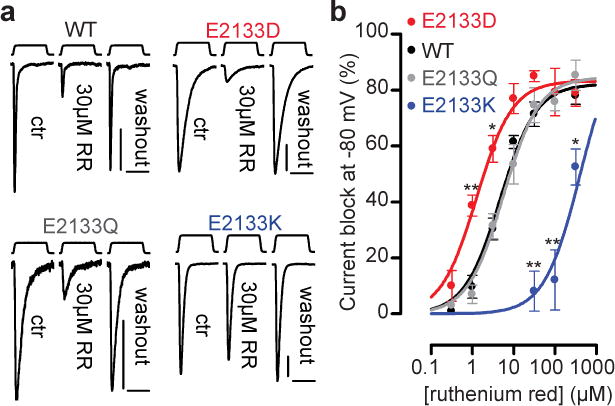
(a) Representative (from 3–10 experimental replicates) MA current traces from cells transfected with mPiezo1 WT, E2133Q, E2133D and E2133K at -80 mV before, during or after application of 30 μM RR. Each trace is an average of 2–4 trials. Probe stimulation displacements are 4.5, 5, 6 and 8 μm, respectively. Scale bars: 300 pA, 100 ms. (b) RR concentration-inhibition curves on MA currents at -80 mV in cells transfected with specified constructs (n = 2–10 per data point; mean ± s.e.m.). One-way ANOVA with Dunn’s comparison to WT done separately for each RR concentration, **P<0.01, *P<0.05.