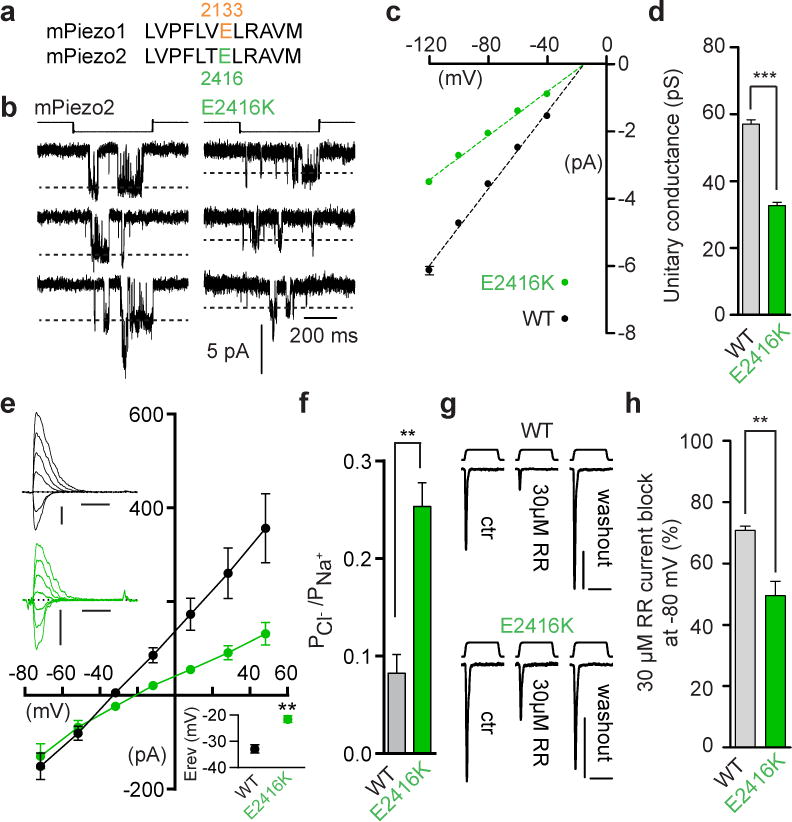
Figure 6. Lysine substitution of E2416 alters pore properties of mPiezo2 channels.

(a) Conservation of mPiezo1 E2133 at position 2416 on mPiezo2 protein. (b) Representative (from 9 and 6 experimental replicates) stretch-activated channel openings at -80mV from cells transfected with mPiezo2 WT and E2416K. Stimulation intensities are -15 and -20 mm Hg, respectively. (c) Average I-V relationships of stretch-activated single channels in mPiezo2 WT and E2416K transfected cells (n = 9 and 6, respectively; mean ± s.e.m.). Single-channel amplitude was determined as the amplitude difference in Gaussian fits of full-trace histograms. (d) Single-channel conductance calculated from the slope of linear regression line of individual cell single-channel I-V relationships (mean ± s.e.m.; Mann-Whitney test, ***P<0.001). (e) Average I-V relationships of MA currents recorded from mPiezo2 WT and E2416K expressing cells with 150 mM NaCl based intracellular solution and 30 mM NaCl extracellular solution. Top left inset: typical recording traces for WT (black) and E2416K (green) from -71.7 to +48.3 mV, Δ20 mV. Scale bars: 100 pA, 50 ms. Probe stimulation displacements are 9 and 8 μm, respectively. Bottom right inset: Average reversal potential (mean ± s.e.m.; n = 6 and 5, respectively; Mann-Whitney test **P<0.01). (f) PCl/PNa permeability ratios of MA currents from cell transfected with mPiezo2 WT, and E2416K (mean ± s.e.m.; n = 6 and 5, respectively; Mann-Whitney test **P<0.01). (g) Representative (from 5 experimental replicates) MA current traces from mPiezo2 WT and E2416K transfected cells at -80 mV before, during or after application of 30 μM RR. Each trace is an average of 2–4 trials. Probe stimulation displacements are 5 and 7 μm, respectively. Scale bars: 100 pA, 100 ms. (h) Average block of MA currents at -80 mV by 30 μM RR in mPiezo2 WT and E2416K transfected cells (n = 5 for each; mean ± s.e.m.; Mann-Whitney test, **P<0.01). Panel (b), (c) and (d) experiments were performed in cell-attached configuration with Na+ as the only permeating cation in the recording pipette.
