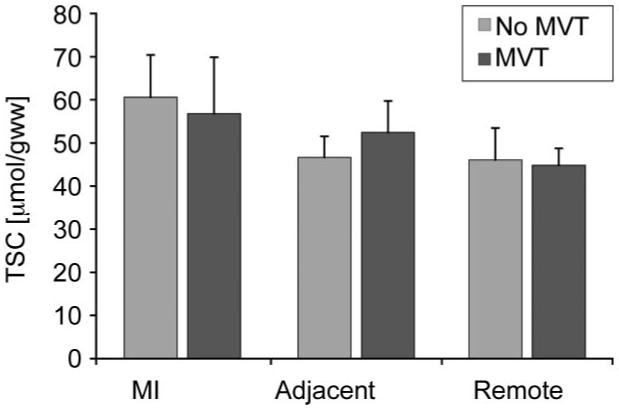
Figure 7.

Bar graph shows cardiac TSC in MI, adjacent LV tissue, and remote LV regions in nine patients in whom MVT was inducible at electro-physiologic testing and in seven patients in whom MVT was not inducible. For this analysis, adjacent LV tissue was assessed in five patients. Mean TSC in MI was 57 μmol/g wet weight ± 13 for nine patients in inducible group and 61 μmol/g wet weight ± 10 for seven patients in noninducible group (P > .05). Mean TSC in adjacent zones assessed in five patients was 54 μmol/g wet weight ± 14 for inducible group and 52 μmol/g wet weight ± 7 for noninducible group (P > .05). Mean TSC in remote myocardial tissue was 46 μmol/g wet weight ± 7 for nine patients in inducible group and 45 μmol/g wet weight ± 4 for seven patients in noninducible group (P > .05).
