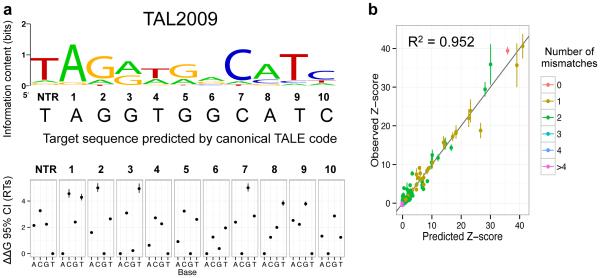
Figure 2. Determining PWMs from custom-designed PBMs.
(a) Representative logo and ΔΔG estimates. The vertical bars represent the 95% credible interval (CI) and the points show the mean of the posterior distribution, in units of RT. The base predicted for each position by the TALE code is indicated below the logo. (b) Representative comparison between the probe z-scores measured in PBMs and the z-scores predicted by the derived PWM. Points represent the mean and vertical bars show its 95% confidence interval. Points are colored by the number of mismatches between the sequence in the probe and the consensus sequence predicted from RVD identities using the canonical TALE code.

