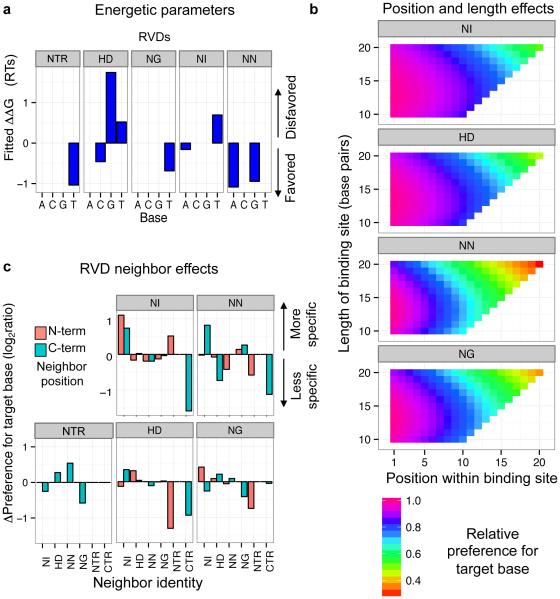
Figure 5. Protein features that affect repeat specificity.
(a) RVD identity. ΔΔG values from the model are indicated for each repeat type with each base. Additionally, the ΔΔGs for the four bases at the 5’ T position, which are contacted by the NTR, are shown. (b) Length and position. The effects of protein length and repeat position on the specificity of each repeat type are shown. (c) Effect of neighboring repeats or terminal regions on specificity. For each repeat type and the NTR, the bar heights display the effect on specificity for different neighbors in the N- or C-terminal direction (orange and teal, respectively). The quantity shown is the log2 ratio between the PWM frequency predicted with and without the presence of a given neighbor in the model. NTR refers to the N-terminal region of the protein. CTR refers to the C-terminal region; repeats with the CTR as the C-terminal neighbor are the half-repeats in the final repeat position.

