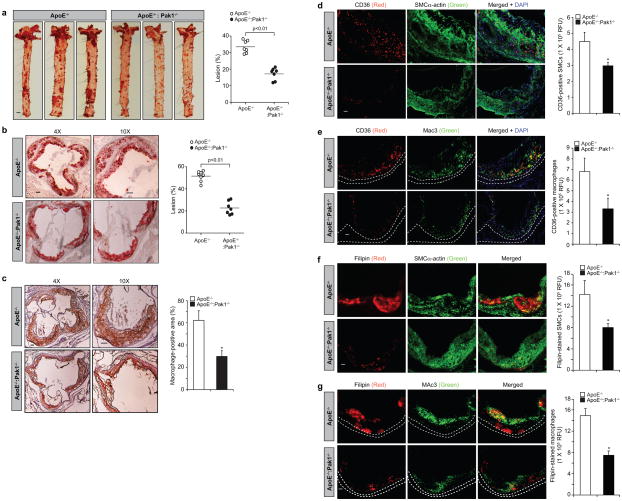
Figure 2. Deletion of Pak1 reduces atherosclerotic plaque progression.
(a) Representative en face staining of aortas from ApoE−/− and ApoE−/−:Pak1−/− mice fed with WD for 16 weeks are shown and the plaque area is presented as lesion % (i.e., % of whole aorta) in the graph. Each symbol represents 1 animal and the horizontal bar indicates the mean value. (b) Representative Oil red O staining of the aortic root sections of the mice described in (a) is shown and the graph represents the quantification of the area positive for lipid staining. (c) Aortic root sections of the mice described in (a) were stained for Mac3 are shown and the graph represents the quantification of the area positive for macrophages. (d–g) Aortic root cryosections of the mice described in (a) were analyzed by double immunofluorescence staining for CD36 in combination with SMCα-actin or Mac3 (d and e) or Filipin in combination with SMCα-actin or Mac3 (f and g). Bar graph represents the quantification of aortic root sections for CD36 and Filipin staining (n=6). Data were presented as Mean ± SD and assessed by Student’s t test. *, p<0.05 vs ApoE−/− mice. Scale bars are 1 mm in Figure 2a, 100 μm in Figure 2b & c and 50 μm in Figure 2d–g.

