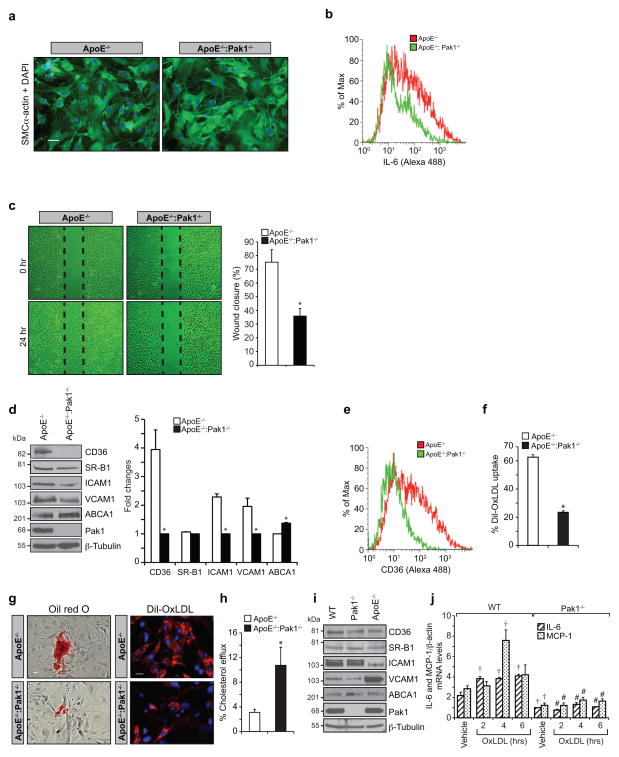
Figure 5. Pak1 regulates SMC migration and lesion formation.
(a–c) Aortic smooth muscle cells from ApoE−/− and ApoE−/−:Pak1−/− mice fed with WD for 16 weeks were isolated, cultured and tested for their purity using anti-SMCα-actin antibodies (a), analyzed for IL-6 expression by FACS (b) and subjected to wound-healing migration assay (c). (d) Aortic smooth muscle cell extracts from ApoE−/− and ApoE−/−:Pak1−/− mice were analyzed by Western blotting for the indicated proteins using their specific antibodies. (e, f) FACS analysis of CD36 expression (e) and Dil-OxLDL uptake (f) are shown. (g, h) SMC isolated from ApoE−/− and ApoE−/−:Pak1−/− mice fed with WD for 16 weeks were either incubated with OxLDL or Dil-OxLDL for 6 hrs and stained with Oil red O (g, left panel) or observed under fluorescent microscope (g, right panel) or subjected to cholesterol efflux (h) as described in “Methods”. (i) Extracts of SMCs isolated from WT, Pak1−/− and ApoE−/− mice fed with chow diet were analyzed by Western blotting for the indicated proteins using their specific antibodies. (j) SMCs from WT and Pak1−/− mice fed with chow diet were treated with OxLDL (10 μg/ml) for the indicated time periods and RNA was isolated and analyzed by QRT-PCR for IL-6 and MCP-1 levels. Bar graph in panel c represents quantification of three independent experiments. Bar graph in panel d represents the quantification of three Western blots each from a group of two pooled arteries. Data were presented as Mean ± SD and assessed by Student’s t test. *, p<0.01 vs ApoE−/− mice; †, p<0.01 vs WT vehicle control; #, p<0.01 vs WT mice + OxLDL. Scale bars are 50 μm in Figure 5a and 100 μm and 50 μm in the left and right panels of Figure 5g, respectively.

