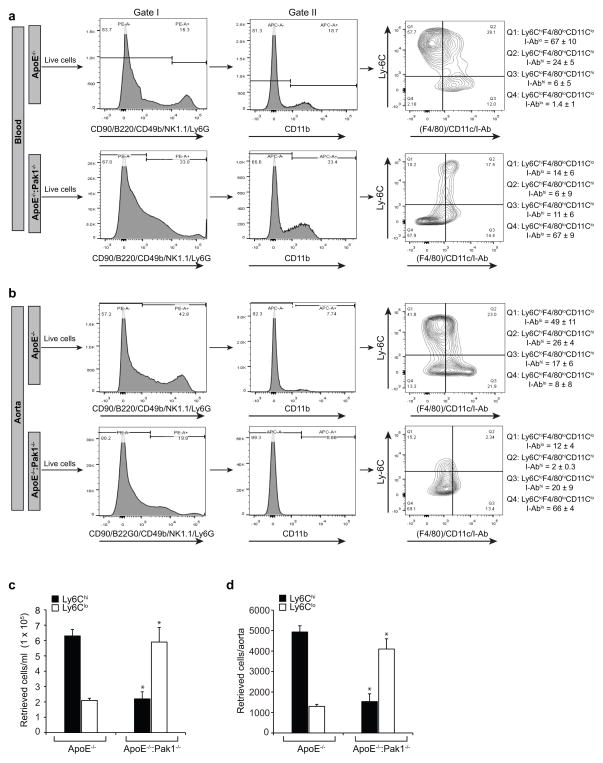
Figure 7. Monocyte subtypes in WD-fed ApoE−/− and ApoE−/−:Pak1−/− mice.
(a) Blood was collected from ApoE−/− and ApoE−/−:Pak1−/− mice fed with WD, peripheral blood mononuclear cells were collected by density-gradient centrifugation, washed with RBC lysis buffer, resuspended into FACS buffer, blocked with mouse serum, washed with FACS buffer and incubated with anti-CD90-PE, anti-CD45R(B220)-PE, anti-CD49b-PE, anti-NK1.1-PE, anti-Ly6G-PE, anti-CD11b-APC, anti-Ly6C-FITC, anti-F4/80-Biotin, anti-I-Ab-Biotin and anti-CD11c-Biotin antibodies. After incubation with the required fluorochrome-conjugated streptavidin-PerCP-Cy5.5 antibodies and washings, the cells were resuspended into sorting buffer and subjected to FACS. The gating strategy is indicated as follows. Live cells (selected based on higher forward-scatter and lower side-scatter) were gated as PE− cells (in gate I). CD11b monocytes were gated as APC+ cells from PE− cells (in gate II). CD11b+ monocytes were gated as Ly6ChiF4/80loCD11cloI-Ablo, Ly6ChiF4/80hiCD11chiI-Abhi, Ly6CloF4/80hiCD11chiI-Abhi and Ly6CloF4/80loCD11cloI-Ablo. All gates were set using full-minus-one (FMO) controls. The mean percentages of each CD11b+ monocyte subpopulations for all mice are indicated in the respective gate. The average percentage of each CD11b+ monocyte subpopulations for all experiments are also listed. (b) Aortas from ApoE−/− and ApoE−/−:Pak1−/− mice fed with WD were collected, digested with a mixture of collagenase I, collagenase XI, Dnase I, and hyaluronidase, washed with HBSS, resuspended in FACS buffer and subjected to FACS as described in panel a. The mean percentages of each CD11b+ monocyte subpopulations for all mice are indicated in the respective gate. (c, d) Bar graphs represent the number of retrieved Ly6Chi and Ly6Clo cells in blood and aorta of WD-fed ApoE−/− versus ApoE−/−:Pak1−/− mice. Data were presented as Mean ± SD and assessed by Student’s t test. *, p<0.01 vs ApoE−/− mice (n= 3 with 3 mice/group/experiment).

