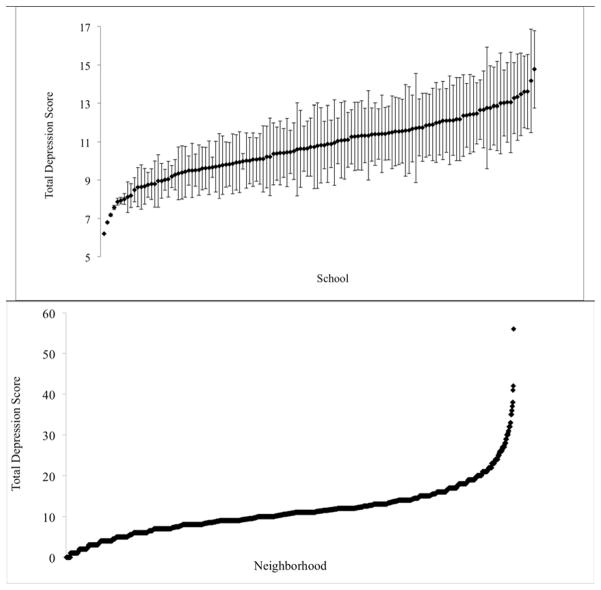
Figure 1. Distribution of Depressive Symptoms Within and Between Schools (N=128) and Neighborhoods (N=2,118).
Dots represent the mean total depression score within the school. 95% bounds around the mean based on the standard deviation (SD) of total depression score in the school are also presented; these values are excluded for the neighborhood due to the high number of neighborhoods present in the data. Values are sorted from left to right by lowest school or neighborhood mean. Average depressive symptoms scores across schools ranged from 6.2 to 14.8. Average depressive symptoms scores across neighborhoods ranged from 0 to 56.

