Fig. 1.
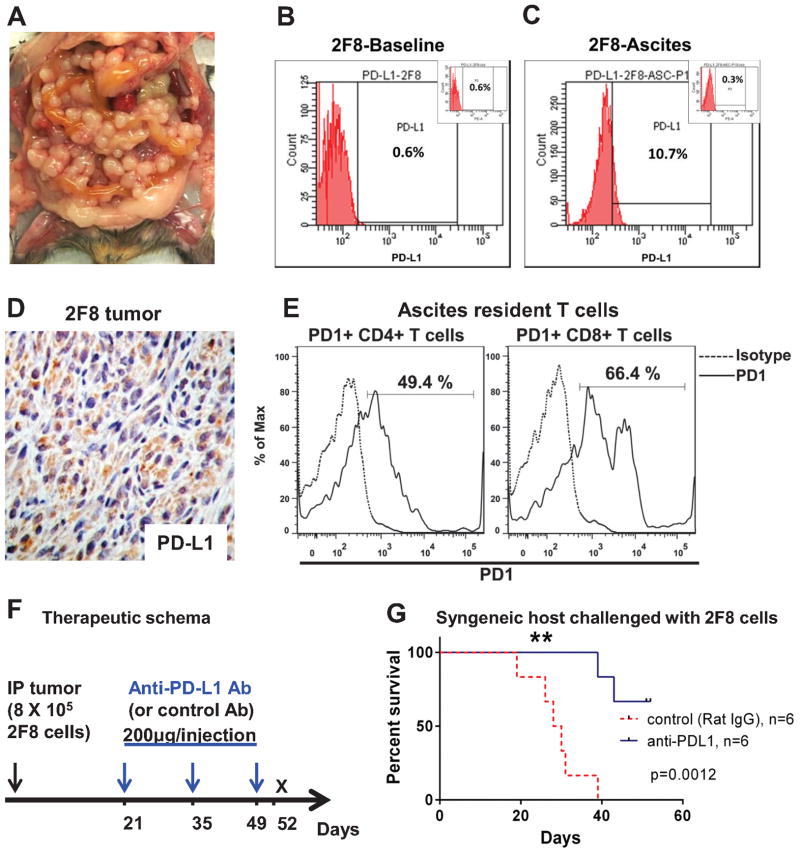
Late treatment with low dose anti-PD-L1 antibody significantly improves survival. A MUC1.Tg mice challenged IP with 8x10⁵ syngeneic 2F8 cells. Image representative of tumor burden at day 29. B–C Flow cytometry staining for cell surface PD-L1 protein expression on 2F8 cells in culture at baseline (B) and after isolation from ascites, post in vivo growth (C). Percentages shows positive cells measured outside the isotype control, shown as insets. D Tumor PD-L1 by IHC. E Flow cytometry detection of PD-1+ CD4+ and PD-1+CD8+ T cells isolated from ascites of 2F8 tumor-bearing mice. Dotted histograms represent staining with isotype control antibody; solid histograms are representative of cells stained with anti-PD-1 antibody. Percentages represent PD-1 positive cells, gated under the CD4 (left) and CD8 (right) populations, respectively. F Therapeutic schema (n=12 mice): protocol was started 21 days after IP tumor challenge with 8x10⁵ 2F8 cells. Half of the mice (n=6) received IP 200 μg of anti-PD-L1 antibody. The remaining (n=6) received control rat IgG. All mice received a total of 3 doses, 2 weeks apart. G Kaplan Meyer survival curve of survival of mice that received anti-PD-L1 antibody (blue) and control IgG (red, p=0.001).

