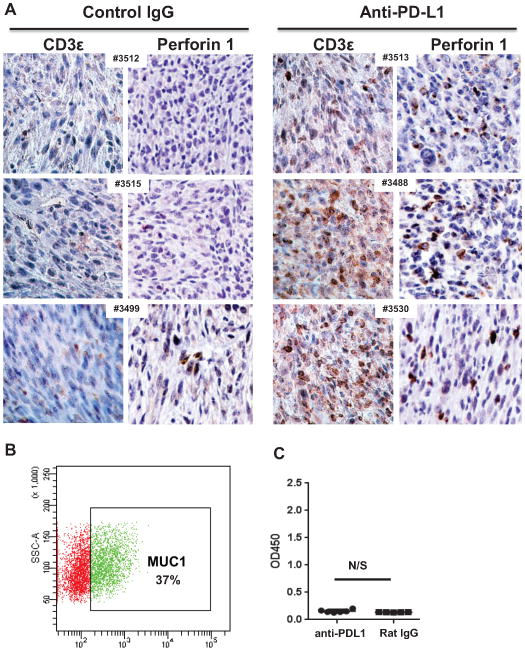
Fig. 3.
Anti-PD-L1 blockade enhances T cell infiltration but does not trigger anti-tumor antibody responses. A IHC analysis of tumors from six different mice, treated with either control rat IgG (left) or anti-PD-L1 antibody (right). Antibodies for CD3 perforin (clone CB5.4). All images were taken with a Nikon digital camera, coupled to an Olympus microscope, at 20x magnification. B Expression of cell surface MUC1 on 2F8 via flow cytometry. Gate shows percent MUC1-positive cells, outside of isotype control area. C ELISA measurement of anti-MUC1 IgG antibodies. The optical density (OD) is shown on the y axis. Values shown represent average values from duplicate wells, calculated after background extraction (sera incubated on MUC1 peptide coated plates minus same sera incubated on bovine serum albumin coated plates). OD, optical density. N/S, not significant, Student’s t test.

