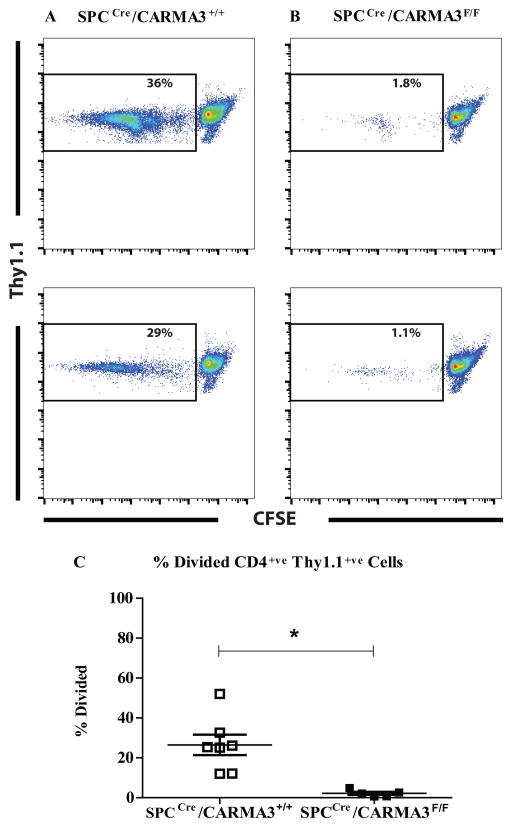
Figure 6. Impaired T cell proliferation in SPCCre/CARMA3F/F mice.
SPCCre/CARMA3+/+ and SPCCre/CARMA3F/F mice received two OVA/Alum immunizations on days 0 and 7 followed by two aerosolized OVA challenges on days 14 and 15. On day 16 the thoracic lymph nodes were isolated and single cells suspensions were incubated with CFSE-labeled Thy1.1+ OT-II CD4+ T cells for 3 days. Representative flow cytometry plots from (A) SPCCre/CARMA3+/+ and (B) SPCCre/CARMA3F/F cultures are shown. (C) The percentage of divided OT-II cells (Thy1.1+/CFSElow) was measured. Data are means ± SEMs of 5–7 mice per group from 2 experiments. *P<0.05.

