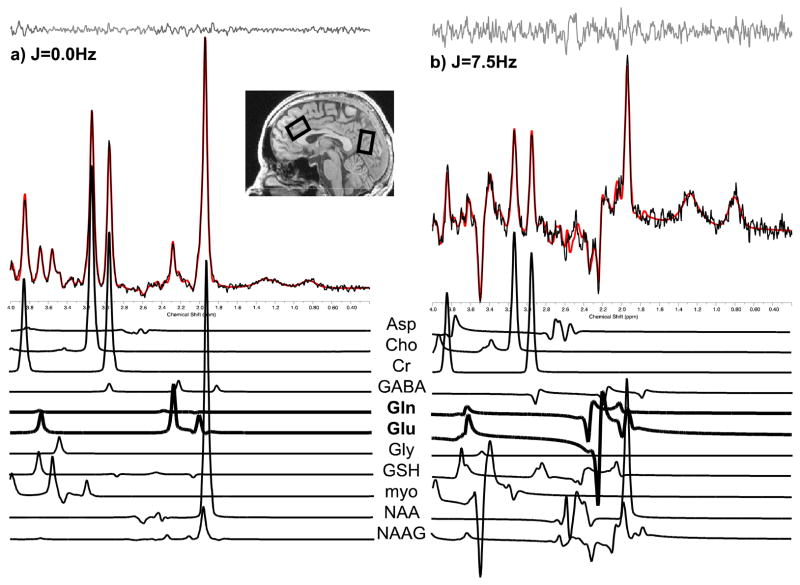
Figure 1.
Sample ACC spectra acquired from a study participant (image inset, left voxel). Raw spectral (black) extractions from J=0.0Hz (a) and J=7.5Hz (b), out of the 64 J-resolved extractions used for fitting across the entire spectral surface (Jensen et al., 2009), are presented with accompanying LCModel fits (red). Stack plots of fitted metabolite components from 2D-JPRESS data sets are presented below each corresponding sample spectrum, highlighting Glu and Gln spectral peaks in bold for these two representative extractions.

