Figure 3.
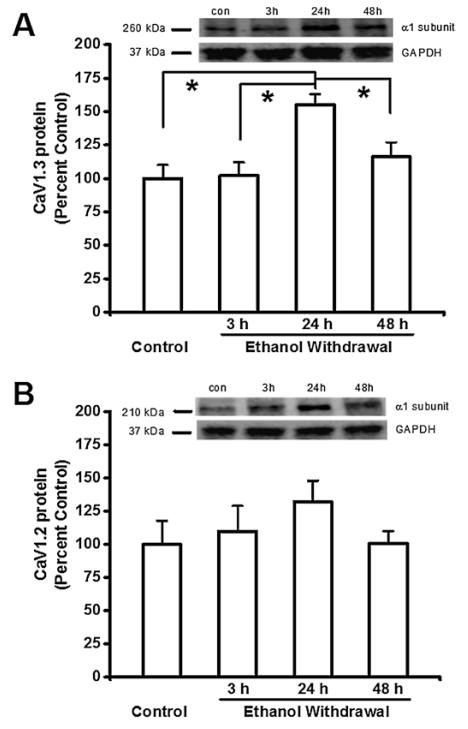
Ethanol withdrawal increases the protein levels of CaV1.3 α1 subunits in the inferior colliculus (IC). Shown in insets are representative immunoblots of the (A<B) GAPDH, (A) CaV1.3 and (B) CaV1.2 α1 subunits measured from control IC samples and IC samples obtained at the indicated times after ethanol withdrawal. The bar graphs summarize the relative protein levels of CaV1.3 α1 and CaV1.2 subunits in the IC, expressed as a percentage of the control group. The density of the 260 kDa immunoreactive band (i.e. the CaV1.3 α1 subunit; panel A) increased significantly in the IC 24 hours after ethanol withdrawal. The density of the 210 kDa immunoreactive bands (i.e. the CaV1.2 α1 subunit; panel B) did not change significantly following ethanol withdrawal. The summary data are shown as the mean ± standard error of the mean. n = 8 rats per group. *p < 0.05 versus control (ANOVA followed by a Bonferroni test or Student-Newman-Keuls).

