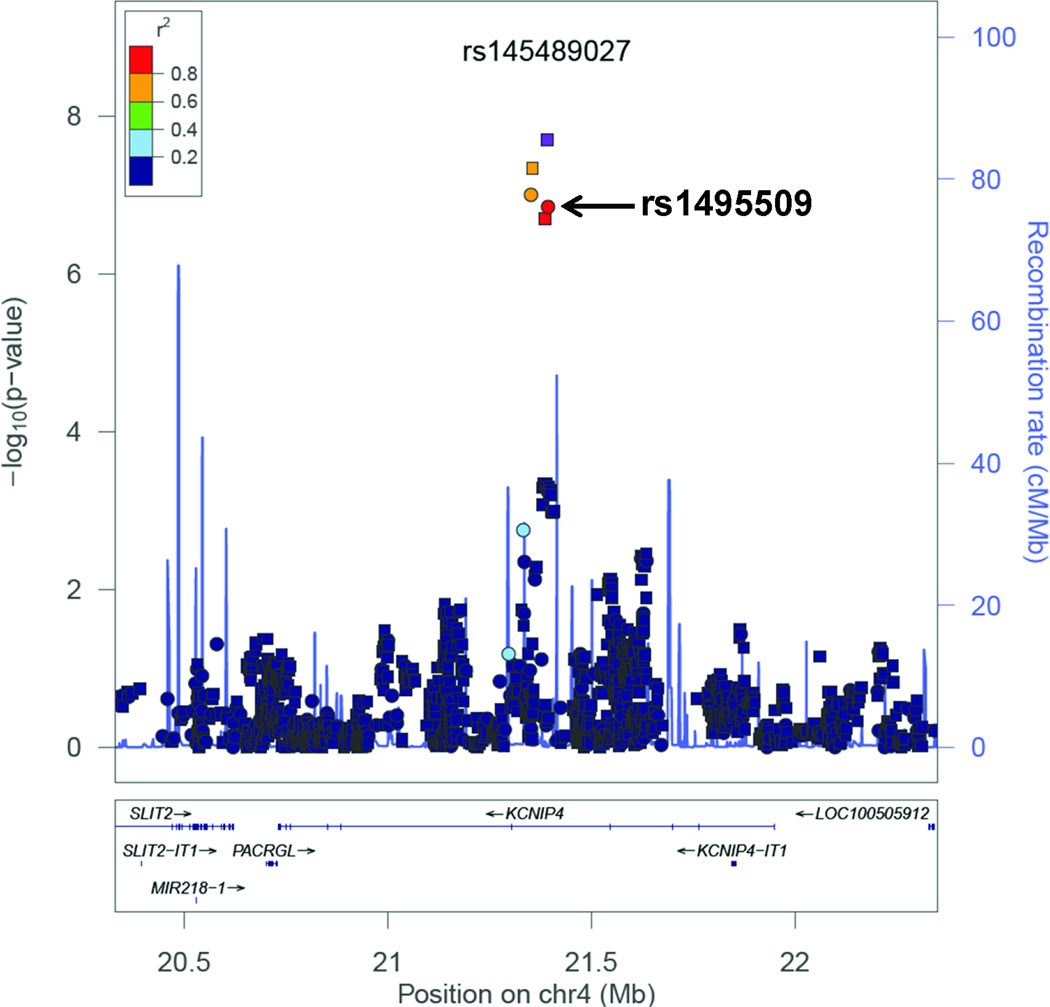
Figure 2.
LocusZoom plot of most strongly associated SNPs from GWAS located in the region of KCNIP4 (chr4:20330238−22350374), centered around SNP rs145489027 (shown in purple). Linkage disequilibrium (based on r2 values) with respect to rs145489027 are based on the CEU reference population. Imputed SNPs are denoted by squares and genotyped SNPs by circles.

