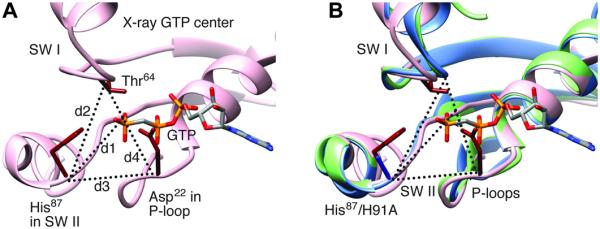
Fig. 6. Structures for region of switch I and II and P-loop.

(A) Structure (x-ray PDB: 4JUW) around GTP showing the residues directly involved in GTP hydrolysis. Distances d1 (between Cα of His87 and the Pγ atom of GTP), d2 (between Cα atoms of His87 and Thr64), d3 (between Cα atoms of His87 and Asp22), and d4 (between Cα atoms of Thr64 and Asp22), listed in Table 2 for our cryo-EM structures and x-ray structures. SW I, switch I; SW II, switch II. (B) Superimposition of our cryo-EM structures in the rotated (blue) and nonrotated (green) complexes on a representative x-ray structure of GTP state (PDB: 4JUW, pink).
