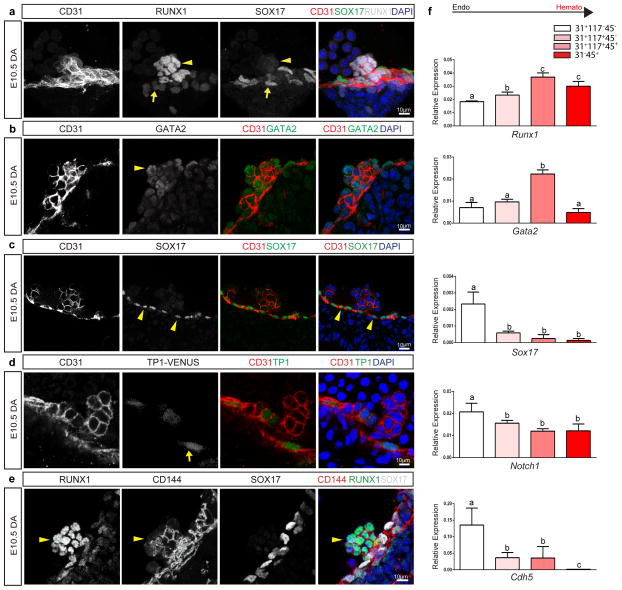
Figure 1. Hematopoietic cell clusters down-regulate arterial gene expression.
(a) – (e) Single channels in black and white, scale bars as shown. E10.5 wildtype dorsal aorta (DA).
(a) Hematopoietic cell clusters of the AGM at E10.5. The endothelial layer and attached hematopoietic cell clusters are CD31+ (red). RUNX1 (grey) is notable in cells comprising the hematopoietic cluster (arrowhead). SOX17 (green) expression is localized to the endothelial layer (arrow). DAPI in blue.
(b) GATA2 (green) is notable in the hematopoietic cell cluster (arrowhead). CD31 (red), and DAPI (blue).
(c) SOX17 (green) immunofluorescence is noted in the cell nuclei of the endothelial layer (arrowheads), as compared to the associated cell cluster. CD31 in red, and DAPI in blue.
(d) Notch pathway activation (green) as measured in the TP-1 Venus mouse line is notable in the endothelial layer (arrow) but less so in the associated hematopoietic cell cluster, CD31 in red. DAPI in blue.
(e) CD144 (red) labels the endothelium and hematopoietic cluster cells (arrowhead), Sox17 in grey, and Runx1 in green.
(f) Embryos at E10.5 were sorted based on cell surface markers to isolate endothelial cells (CD31+CD117−CD45−), hematopoietic cluster cells (CD31+CD117+CD45−), maturing cluster cells and HSPCs (CD31+CD117+CD45+), and mature hematopoietic cells (CD31−CD45+). Bar graphs depict transcript expression (RT-PCR) in each subgroup for Runx1, Gata2, Sox17, Notch1, and Cdh5 (CD144). Differing letters represent significance between groups where a versus b, or b versus c, or a versus c, is significant to a p value < 0.01 or less, n=3 litters, 24 embryos

