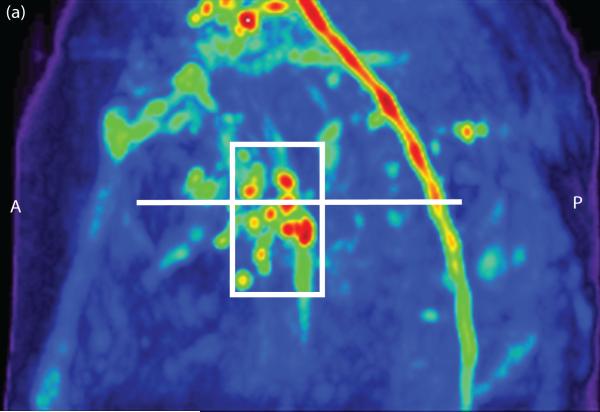
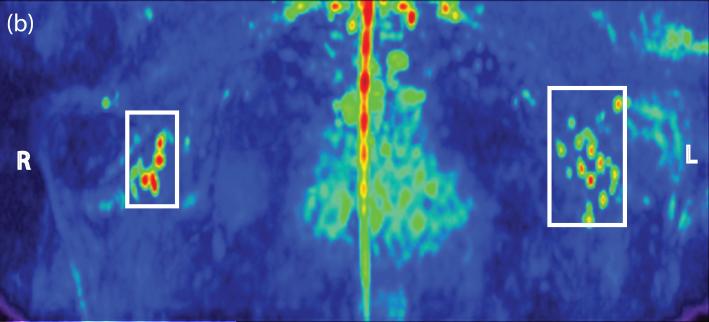
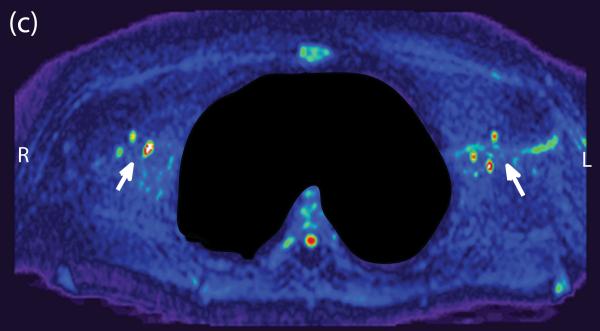
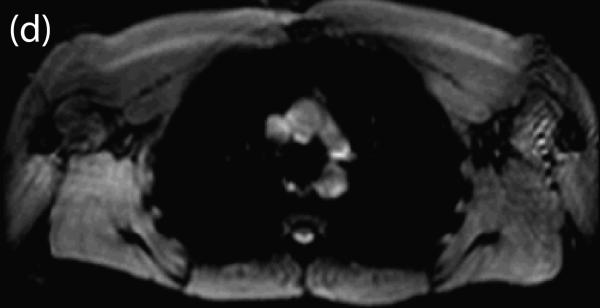
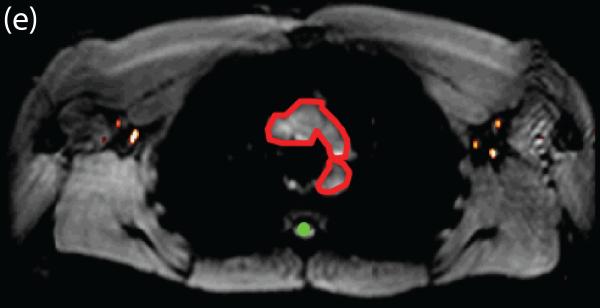
Figure 2. Lymph node identification.
(a,b,c) A representative DWIBS scan (30 yr/M) clearly demarcates the lymph nodes across orthogonal axes. A single axial slice, such as the one shown here (white line) is used to guide the location of the spin labeling positioning. (d) Corresponding control spin labeling image, whose location and planning was guided by the DWIBS contrast. (e) The DWIBS image overlaid on control image and thresholded to identify different structures (green=CSF; yellow = lymph) and to draw the ROIs (2 – 4 voxels) for evaluating lymph kinetic curves.

