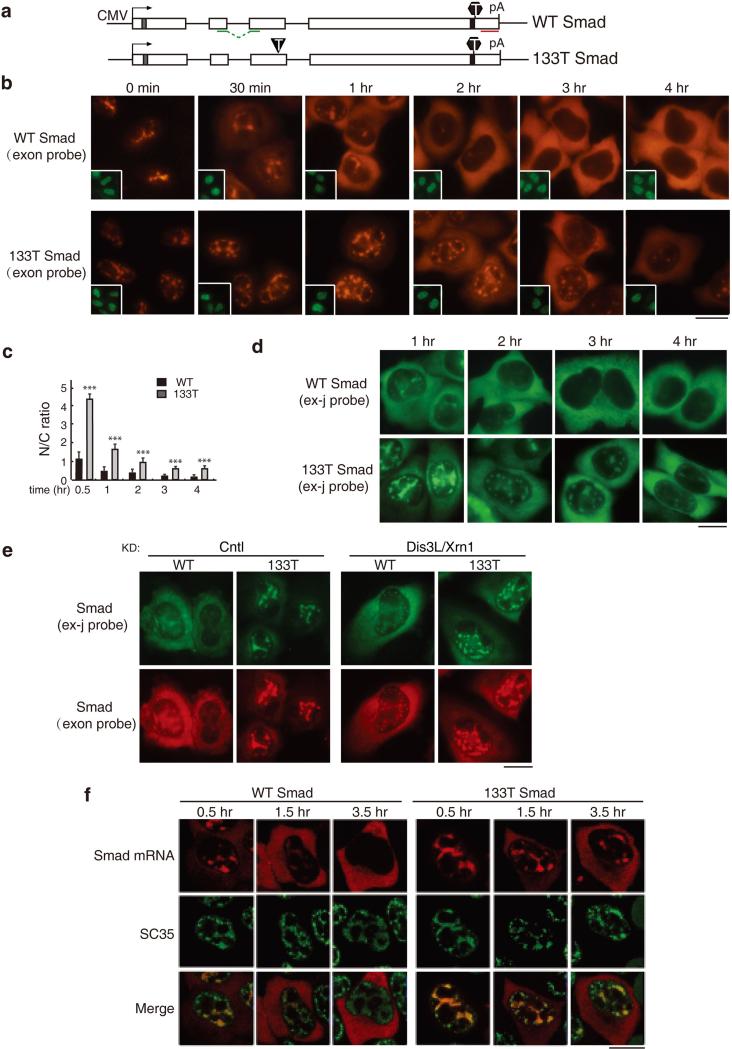
Figure 1. PTC+ Smad mRNAs Are Retained in Nuclear Speckle Domains.
(a) Schematic of Smad constructs. The CMV promoter and BGH polyA sites and the location of the FISH probe (exon probe, red line; exon-exon probe, green line) are shown. The grey and black bars indicate Myc and HA tag respectively. The black triangle and hexagon indicate PTC and physiological stop codon respectively. (b) Equal amount of Smad constructs (50 ng/μl) were microinjected into nuclei of HeLa cell, and α-amanitin was added to block transcription 15 mins after microinjection. FISH of Smad transcripts were carried out with exon probe at indicated time after addition of α-amanitin. Insets show FITC-conjugated dextran co-injected as an injection marker. Scale bar, 10 μm. (c) N/C ratios were determined for a minimum of 30 cells per construct per time point. The graph shows the averageN/C ratios for WT and 133T Smad mRNAs at each time point, and error bars indicate the standard errors among three independent experiments. Statistical analysis was performed using the Student's t test. *P<0.05; **P<0.01; ***P<0.001. (d) Same as B, except that FISH was carried with with the exon-exon probe. (e) Equal amount of Smad constructs (50 ng/μl) were microinjected into nuclei of control knockdowned cells or Dis3L and Xrn1 co-knockdowned cells. 15 mins after microinjection, α-amanitin was added to block transcription. FISH was carried out with both exon-exon probe (green) and exon probe (red) by 1 hour. (f) Same as (B), except that the injection marker was omitted and immunofluorescence using an SC35 antibody was carried out. Confocal microscopy was used to visualize the cells. See also Figure S1 and S2.

