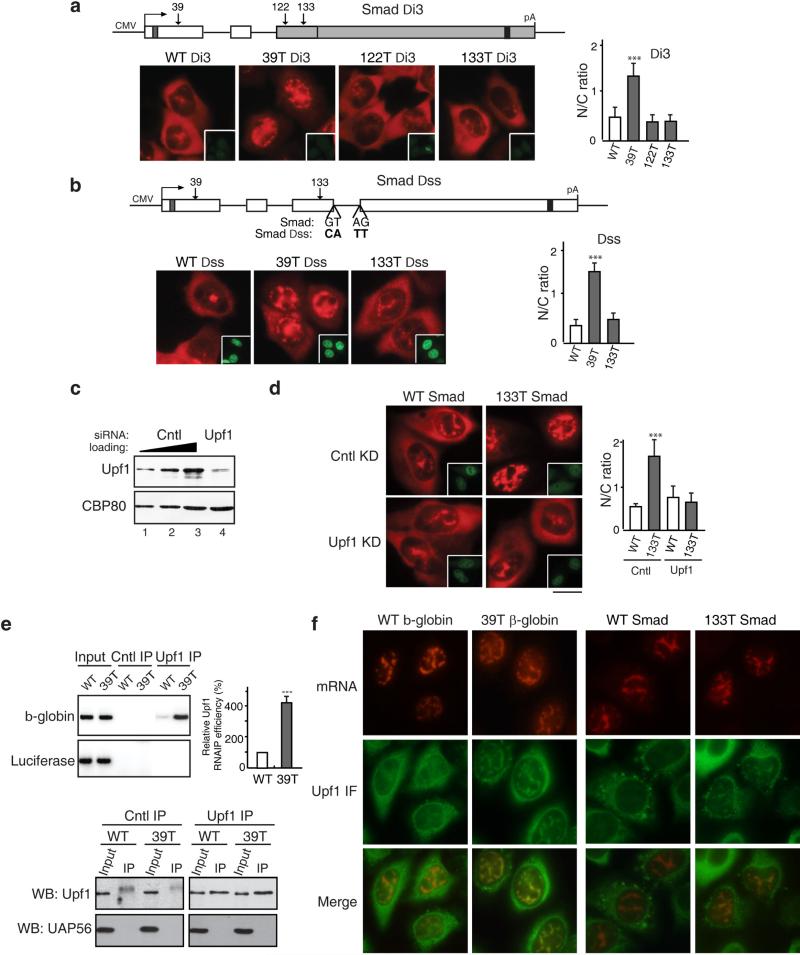
Figure 8. Upf1 Is Required for Nuclear Recognition and Retention of PTC+ mRNAs.
(a) Schematic of Smad Δi3 constructs. WT and PTC+ Smad plasmids (50 ng/μl) were microinjected into the nuclei of HeLa cells, and α-amanitin was added 15 mins after microinjection. FISH of Smad transcripts was carried out at 1 hr after addition of α-amanitin. Insets show the injection marker. The graph shows the average N/C ratios for Smad mRNAs, and error bars indicate the standard errors among three independent experiments. Statistical analysis was performed as in Figure 1C. (b) Same as (a), except that 5’ and 3’ splicing sites on the last intron of WT, 39T and 133T Smad plasmids were mutated as indicated. The graph shows the average N/C ratios and error bars indicate the standard errors among three independent experiments. Statistical analysis was performed as in Figure 1C. (c) Western blot analysis using whole-cell lysates from control or Upf1 knockdown cells probed with an antibody against Upf1 or an antibody against eIF4AIII as a loading control. (d) WT and 133T Smad DNAs were microinjected into the nuclei of control or Upf1 knockdown HeLa cells, and α-amanitin was added 15 mins after microinjection. FISH of Smad transcripts was performed at 1 hr after addition of α-amanitin. Scale bar, 10 μm. The graph shows the average N/C ratios and error bars indicate the standard errors among three independent experiments. Statistical analysis was performed as in Figure 1C. (e) Using an antibody to Upf1 or an unrelated protein, immunoprecipitations were carried out from nuclear extracts prepared from HeLa cells transfected with WT or 39T β-globin constructs. RNAs were extracted from immunoprecipitates followed by RT-PCR using primers to β-globin or Luciferase. The relative mRNA level of β-globin to Luciferase was quantified and indicated in the graph. Error bars indicate the standard errors from three independent experiments. Statistical analysis was performed as in Figure 1C. (f) WT and PTC β-globin and Smad constructs were microinjected into the nuclei of HeLa cells, and α-amanitin was added 15 mins after microinjection. 1 hr after addition of α-amanitin, cells were permeabilized with digitonin (40mg/ml) for 2 mins followed by FISH and immunofluorescence with the Upf1 antibody. See also Figures S9 and S10.

