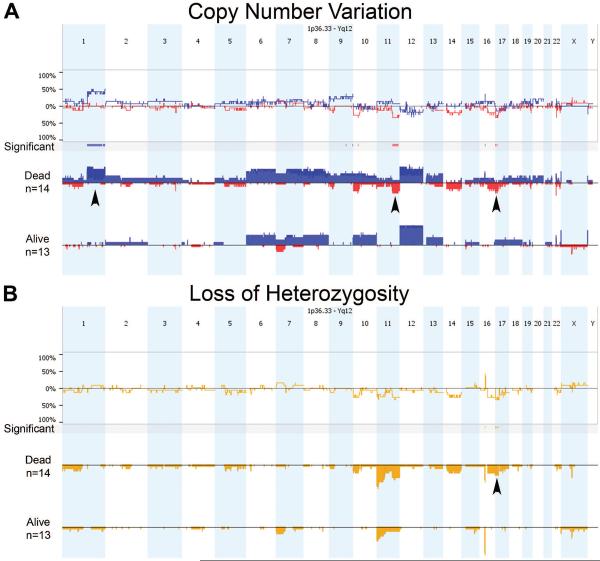
Figure 2.
Comparison of copy number variation (A) and loss of heterozygosity (B) across the Kenyan Wilms tumor genome between patients who died (n=14) or survived until conclusion of the study (n=13). (A) Copy gain is denoted in blue and loss in red, and arrowheads highlight a statistically significant gain at 1q and loss at 11q among those who died. Other significant regions are noted. (B) For loss of heterozygosity, only two regions were statistically different between outcome groups: 16p and 17p. The latter (arrowhead) covers the TP53 region.

