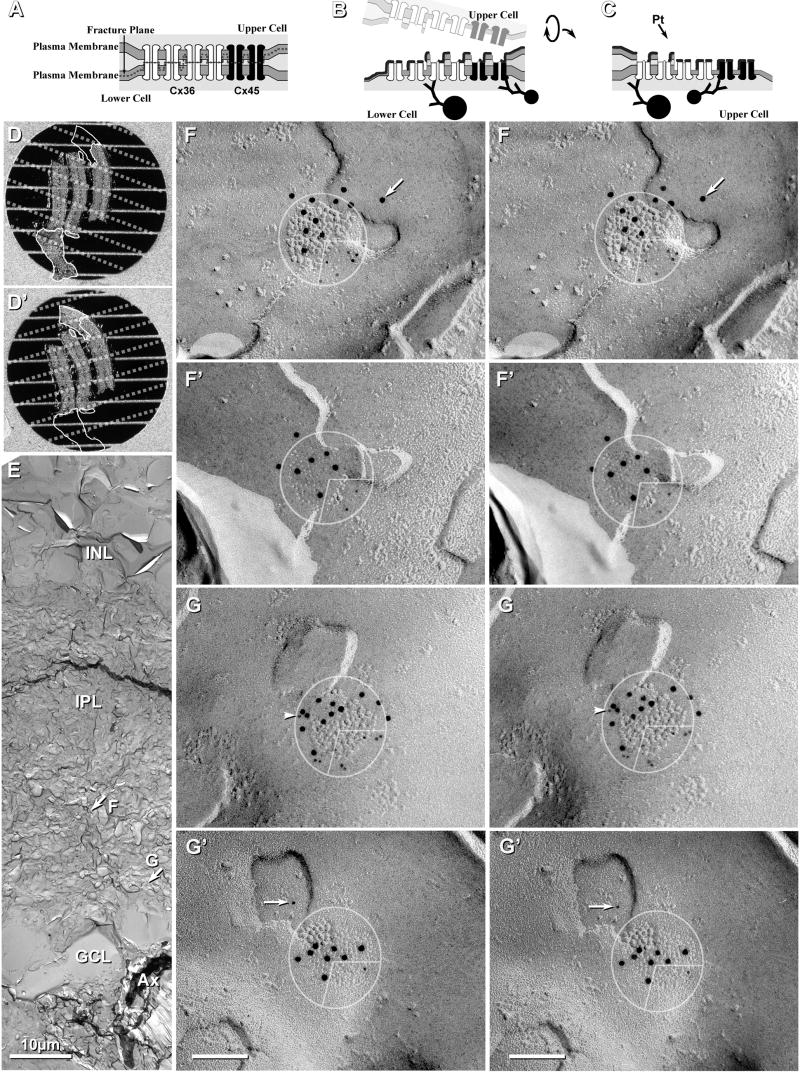
Figure 6.
Images and the interpretation of labeling in matched double-replicas. A-C, Scale diagram showing gap junction before and after freeze fracturing and retrieval of complementary replicas. A, The fracture plane (dashed line) separates connexons at their points of contact in the extracellular space, leaving all connexons of the lower cell for subsequent immunogold labeling. B-C, Creation of double-replicas having complementarity of E- and P-fracture faces. Each matching replica contains connexons from only one cell, but the E-face of one cell and the P-face of the other cell. D,D′, Images from dissecting microscope showing matched double-replicas containing three strips of retina after SDS washing and immunogold labeling. E, Low-magnification image of one side of a complementary replica, with locations of two of the mapped gap junctions indicated by arrows. F,F′,G,G′, High magnification stereoscopic views of complementary replicas of two gap junctions, with 10-nm gold labeling Cx36 and 5-nm gold labeling Cx45. Cx36 labeling is present beneath three quadrants of both gap junctions (E-face pits in top replica and complementary P-face particles in bottom replica). 5-nm Cx45 labels are present in the lower right quadrant. Initial pre-coating with 2-3 nm of carbon partially obscured E-face connexon pits. Arrow (in F) indicates a gold bead beyond the 28-nm radius of immunogold labeling. Arrowhead (in G′) indicates a 5-nm gold label for Cx45, with possible corresponding label in the complementary image (G, arrow). Scale bars, 0.1 μm unless otherwise indicated.

