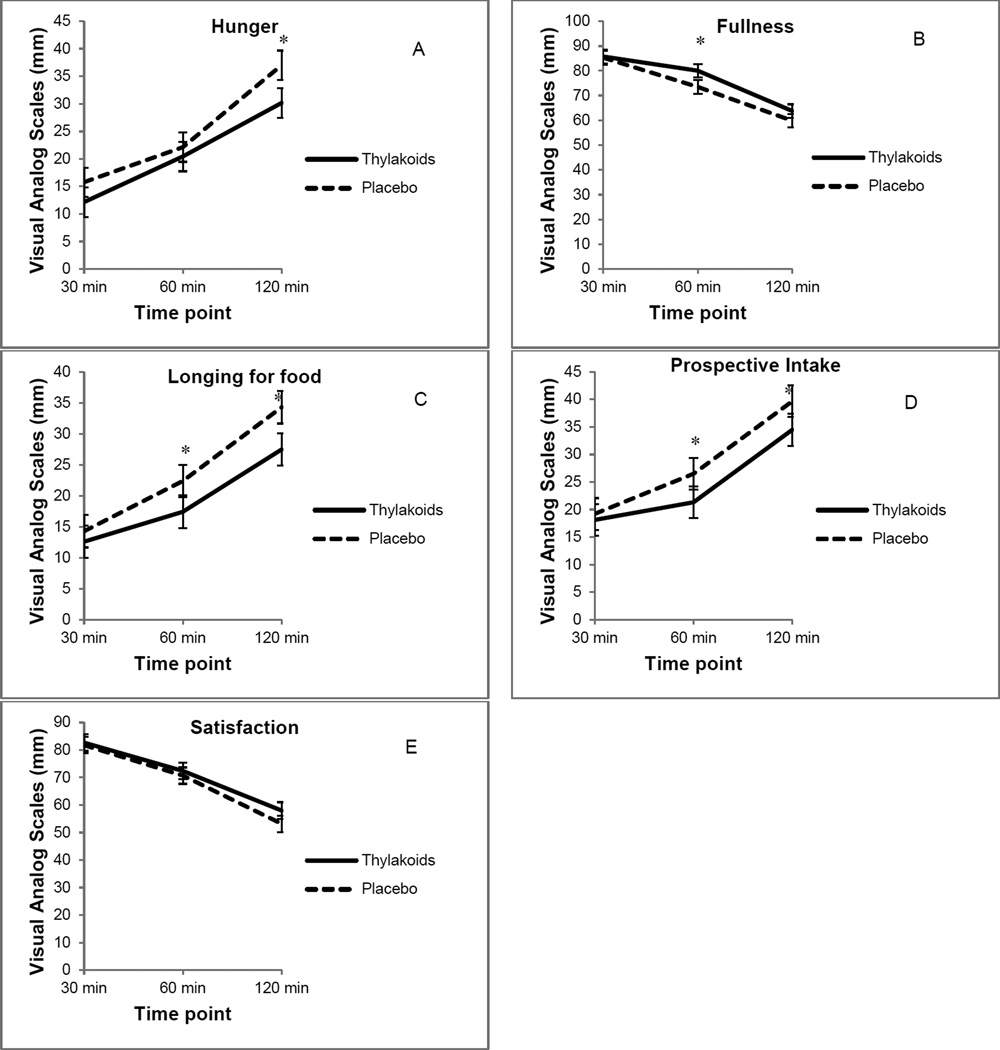
Figure 1.
A, B, C, D, E Visual analog scale ratings for satiety (n = 59) over two hours after consuming the spinach extract or a placebo. (A) Hunger: Overall differences, 4.0720 mm ± 1.52 (p < 0.01), *120 min (p < 0.01) (B) Fullness: Overall differences, 3.62 mm (p = 0.04), *60 min (p = 0.03) (C) Longing for food: Overall differences, 4.50 mm ± 1.32 (p < 0.01), *60 min (p < 0.03) and *120 min (p < 0.01). (D) Prospective intake: Overall differences, 3.83 mm ± 1.35 (p < 0.01), *60 min (p = 0.03) and *120 min (p = 0.03). (E) Satisfaction: Overall differences were not significant. Values are mean ± standard error

