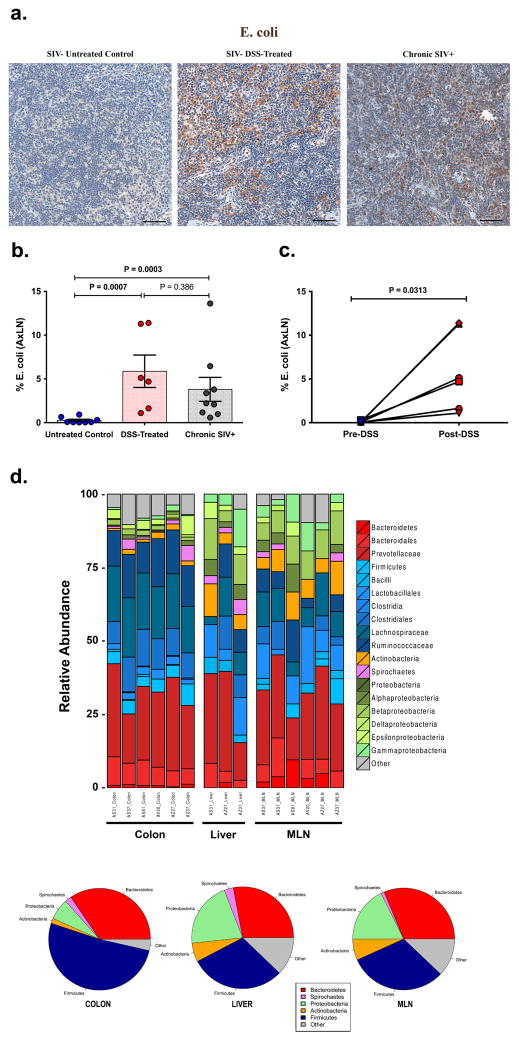
Figure 3. Effect of DSS induced GI tract damage on systemic microbial translocation within distal tissues.
(a) Representative images of E. coli stained AxLN showing the lack of microbial translocation in untreated control RM and increased presence of bacterial products in DSS-treated and chronic SIV+ RMs. (b) Quantification of the percent area of AxLN positive for E. coli. (c) Longitudinal analysis of bacterial products (E. coli) in peripheral LNs pre- and post-DSS treatment. P values are based on the Mann-Whitney test (b) or the Wilcoxon matched pairs test (c). Untreated control RMs (blue circles) n=8, acute DSS-treated RMs (red circles) n=6, and chronic SIV+ RMs (grey circles) n=9. Scale bars = 100 μm. (d) Analysis of bacterial communities within the colon and identification of translocating gut flora following DSS treatment analyzed for 16S rDNA by 454 pyrosequencing. Bar graphs indicate the relative makeup of the bacterial community in individual animals at each tissue site. Pie charts show the average bacterial community makeup of all animals shown above in colon, liver, and MesLN. Analysis of molecular variance (AMOVA) with uncorrected pairwise distances calculated from all aligned reads was performed comparing colon and liver (P = 0.018), colon and MLN (P <0.001) and liver and MLN (P = 0.5). Bar graphs show group means ±SEM with individual animal data points shown.

