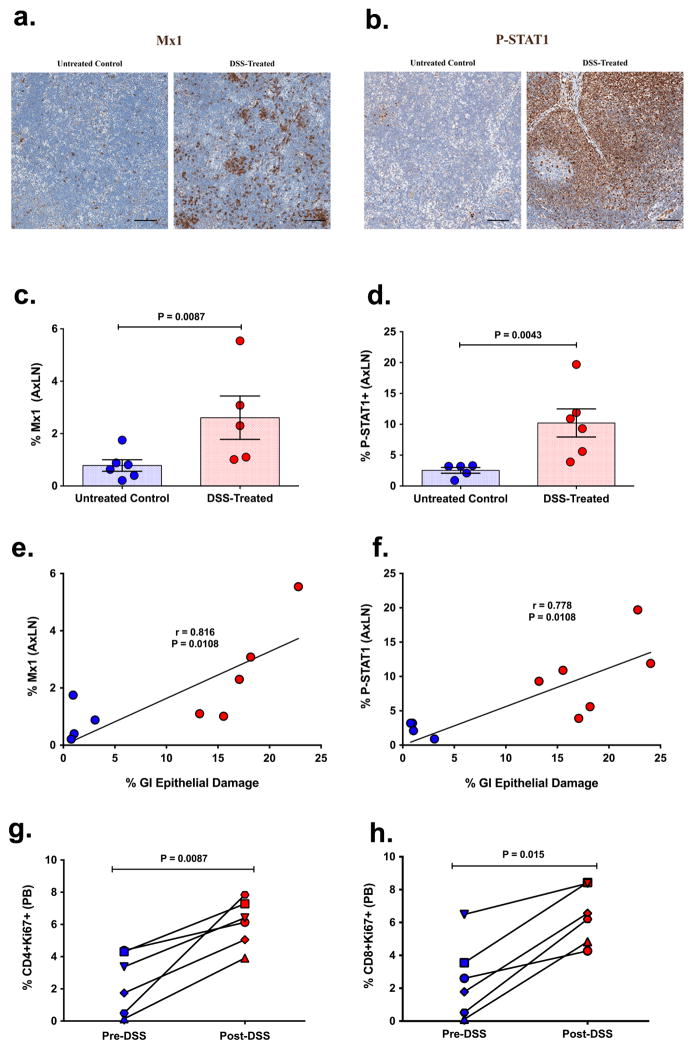
Figure 4. Effect of DSS induced GI tract damage on systemic inflammation and immune activation within the distal AxLN.
Representative images of (a) Mx1 and (b) P-STAT1 stained AxLNs showing limited inflammation in untreated control RMs and increased inflammation in DSS-treated RMs. Quantification of the percent area of the AxLN positive for (c) Mx1 and (d) P-STAT-1. Direct positive correlation between the extent of GI epithelial damage and the magnitude of (e) Mx1 and (f) P-STAT1 expression in AxLNs. Lines are based on linear regression and r and P values are based on Spearman rank correlation coefficient. Longitudinal analysis of (g) CD4+Ki67+ and (h) CD8+Ki67+ in the peripheral blood pre- and post-DSS treatment. P values are based on the Mann-Whitney test (c–d) or the Wilcoxon matched pairs test (g–h). Untreated control RMs (blue circles) n=4 (e–h) to 6 (c–d) and acute DSS-treated RMs (red circles) n=6, with individual shapes representing individual animals (g–h). Bar graphs show group means ±SEM with individual animal data points shown.

