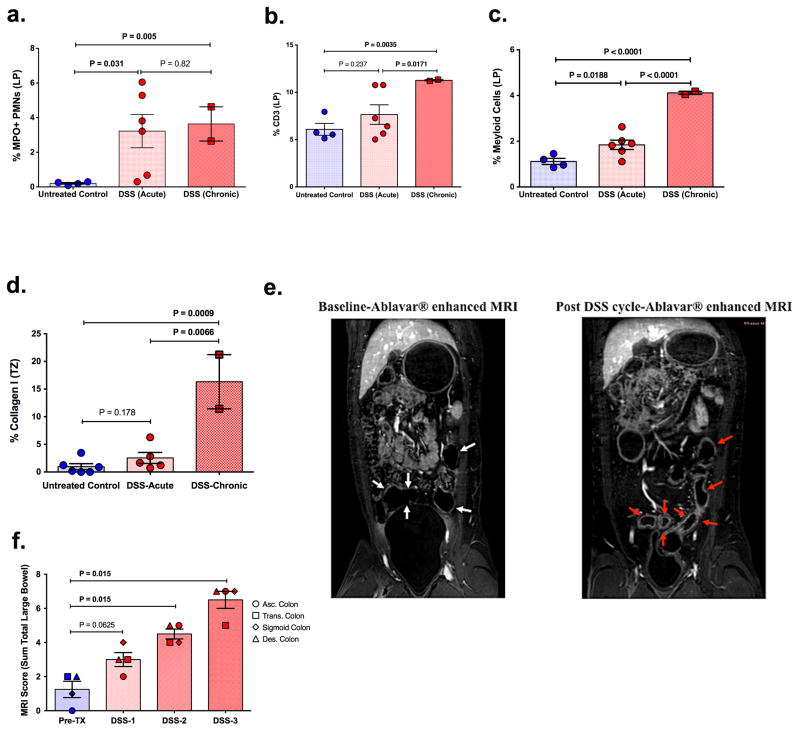
Figure 5. Features of DSS induced chronic colitis and noninvasive MRI evaluation.
Quantification of the percent area of the colon (all segments) that is occupied by (a) MPO+ PMNs, (b) CD3+ T cells, and (c) CD68/CD163+ myeloid/macrophages in untreated control and DSS-treated acute and chronic colitis RMs. (d) The percent area of the AxLN that is occupied by collagen 1 in untreated control and DSS-treated acute and chronic colitis RMs. (e) Prominent inflammatory changes appear as enhancement with Ablavar® (red arrows) in the colon after DSS treatment, as well as evident increased thickness of the colonic wall, stenosis and narrowing of colonic cavity. (f) Summation of the qualitative MRI scoring for each GI tract segment from both RMs showing the progression in the severity of colitis. P values are based on the Mann-Whitney test. Untreated control RMs (blue circles) n=4 (a–c) to 6 (d), acute DSS-treated RMs (red circles) n=6, and chronic DSS-treated RMs (red squares) n=2. Bar graphs show group means ±SEM with individual animal data points shown.

