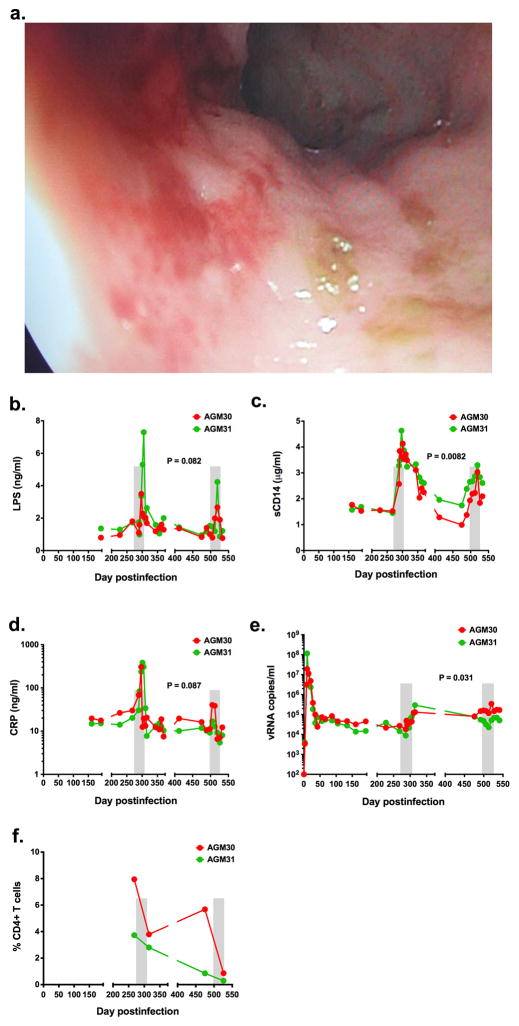
Figure 6. Impact of DSS treatment on chronically SIV+ AGMs.
(a) Colonoscopy image showing multifocal mucosa thickening, redness and ulcerations. Longitudinal changes in plasma levels of LPS (b), sCD14 (c), CRP (d), and viral loads (e), and frequency of mucosal CD4+ T cells (f) in SIV+ AGMs (n=2) before and after two DSS treatments (shown by grey bars). P values were derived from repeated measures analysis of variance, linear hierarchical mixed effects models as described in methods section.

