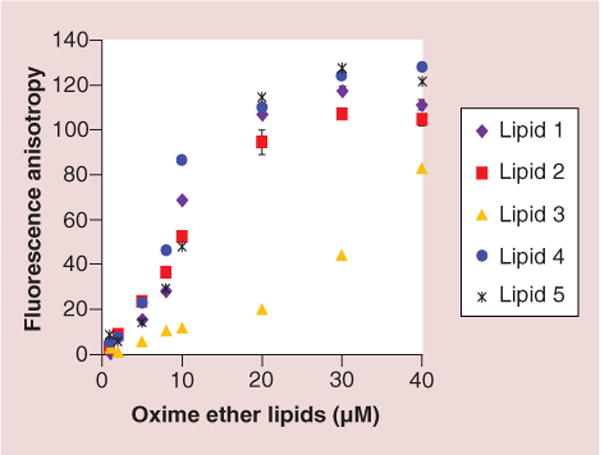
Figure 5. Nucleic acid binding affinity of oxime ether lipid liposomes.

Liposomes prepared from OEL were diluted to a range of lipid concentrations (1–40 μM) and 100 nM of Alexa 488 RNA/DNA hybrid was added to the samples. Fluorescence anisotropy was determined (see Methods section) as a measure of binding affinity. Lipid 1 (closed purple rhombus), lipid 2 (closed red square), lipid 3 (closed yellow triangle), lipid 4 (closed deep blue circle) and lipid 5 (black asterisk). The error bars represent standard error of the mean (±SEM) calculated from the values of two independent experiments (n = 2).
