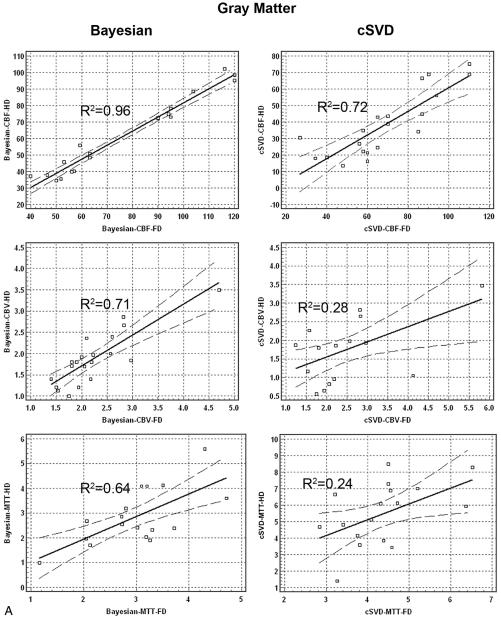
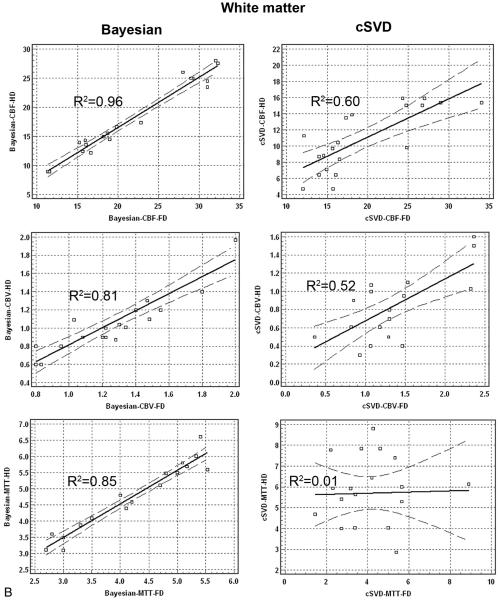
FIG 2.
Bivariate regression scatterplots with 95% CI lines of quantitative analysis of CBF, CBV, and MTT derived from full-dose (0.1-mmol/kg) and half-dose (0.05-mmol/kg) DSC perfusion imaging in both gray matter and white matter. There is significantly higher correlation between HD and FD perfusion values in Bayesian-versus cSVD-processed data.


