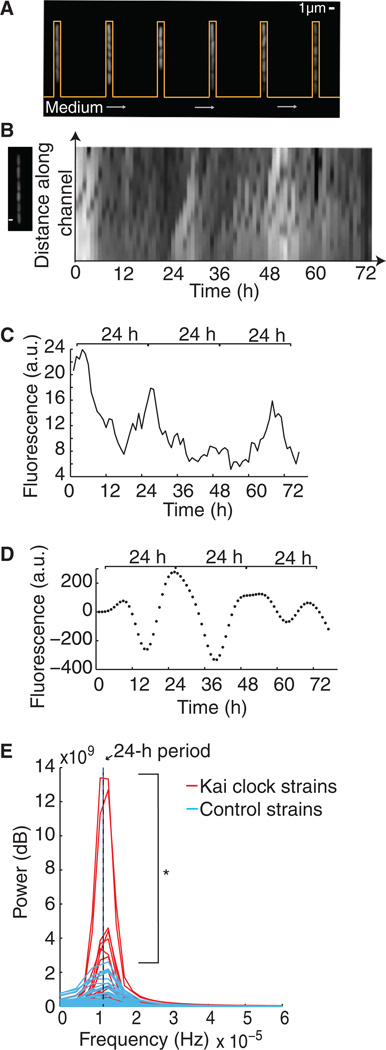
Fig. 3. Single cells demonstrate oscillatory behavior.
(A) Fluorescent cells in channels in the microfluidic device (orange outline) with medium flowing (gray arrows) across the base of the channels, allowing for long-term microscopy assay of single-cell fluorescence. (B) Fluorescent cells in one channel of the microfluidic device at one time point (left). Kymograph shows fluorescence of a single channel over time (right), after overnight induction and minimal medium shock synchronization (at t = 0). Time interval, 1 hour. (C) Average fluorescence of a single mother cell, grown as in (A) and (B), containing the synthetic reporter and Kai clock components. (D) Bandpass-filtered (circadian periods of 20 to 30 hours) data from (B) to compare the strength of circadian periodicity across multiple single-cell traces. (E) Fourier spectra of the time courses of Kai clock strains (red, N = 65) or control strains containing only the reporter (blue, N = 48), both filtered as in (D). Eleven percent of cells had a higher power than the control cell with the highest power. Asterisk indicates that the overall distribution of power of the circadian clock cells is greater than that of controls (one-tailed, two-sample Kolmogorov-Smirnov test, P = 0.001). Black line indicates frequency corresponding to a 24-hour period.

