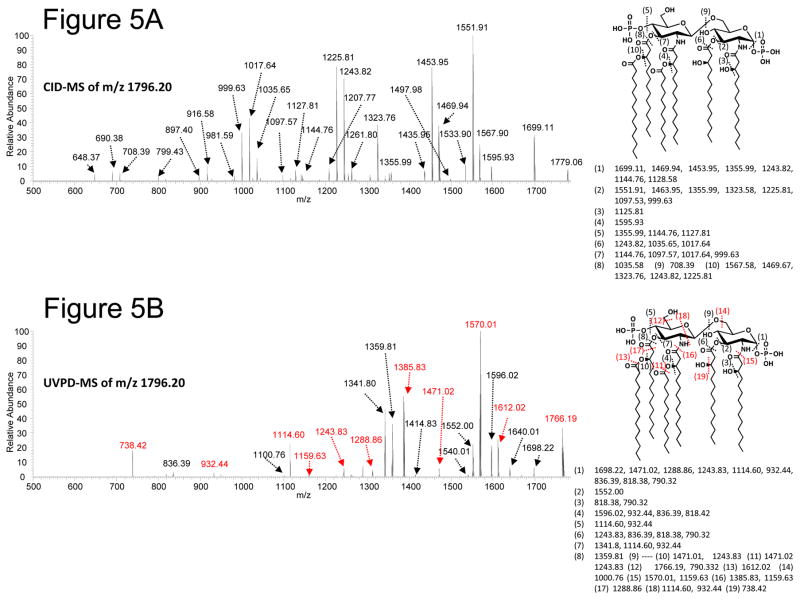
Figure 5.
MS/MS analysis of lipid A isolated from E. coli K-12 (W3110). Collision induced dissociation (A) or ultraviolet photodissociation (B) were used to fragment the precursor ion m/z 1796.2. Spectra are shown on the left with corresponding fragmentation maps on the right. Black dashed lines indicate fragmentation associated with both CID and UVPD, while red dashed lines (B) indicate UVPD specific product ions.

