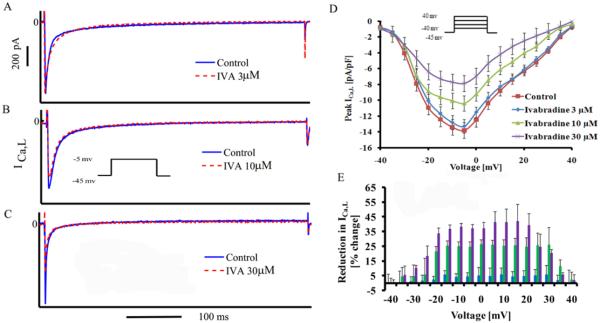
Figure 3. Effect of IVA on Ica,L.

(A–C) Representative effect of IVA on maximal Ica,L, (D) average ICa,L amplitude-voltage relationship under control conditions and in the presence of different IVA concentrations, and (E) relative reduction in ICa,L as a function of membrane potential (n=12 for control and 3 μM IVA; n=9 for 10 and 30 μM IVA).
