
Figure 2. Quantitative real-time PCR detection of SP induced mature miRNA expression.
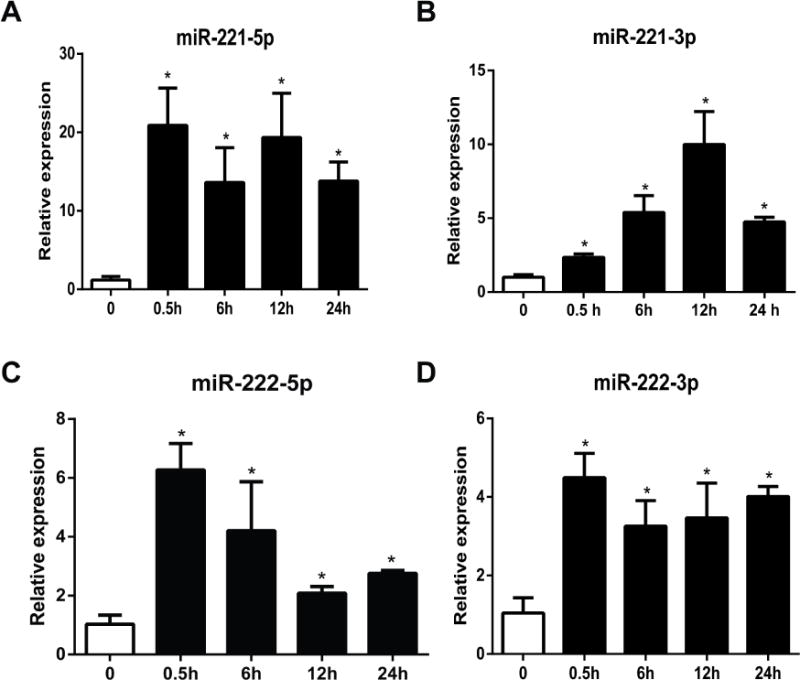
Mature miRNAs expression quantification was performed after 0.1 μM SP treatment (0.5, 6, 12 and 24 hours) of NCM460-NK-1R cells. Expression levels of miR-221-5p, miR-221-3p, miR-222-5p, and miR-222-3p were assessed by RT-PCR analysis. *p<0.05, data show mean ± standard deviation of triplicate samples per experimental condition.