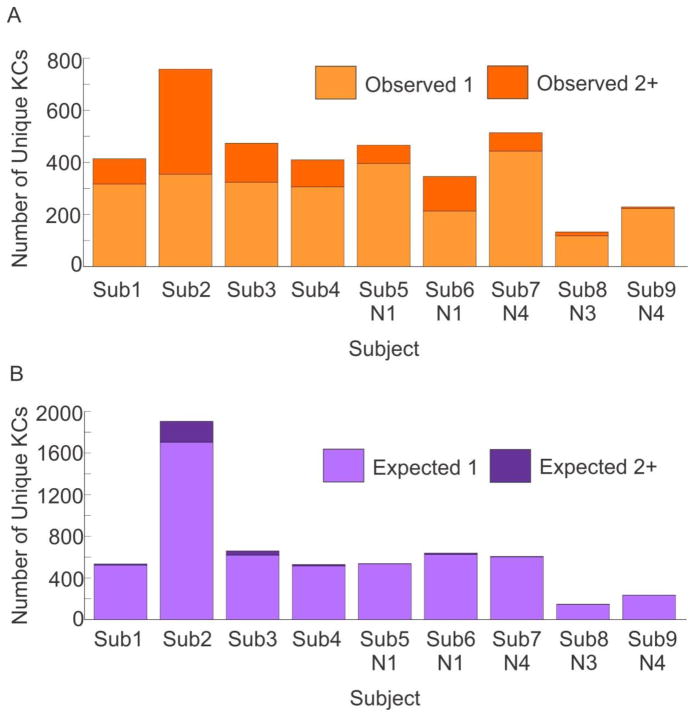
Figure 6. Observed manual KCs versus those expected under the null hypothesis of independent occurrence, for representative nights for each subject.
A. KC events observed for each subject were classified into two groups: KCs with one participating channel (light orange) and KCs with two or more participating channels (dark orange). B. KC events derived from simulating an expected distribution for each subject were classified into the same two groups: one channel (light purple) and two or more channels (dark purple). For all subjects, there are more KCs that only occur in one channel expected under the null hypothesis than were actually observed. These distributions are tested statistically using a Fisher’s exact test and these results are listed in Table 3.

