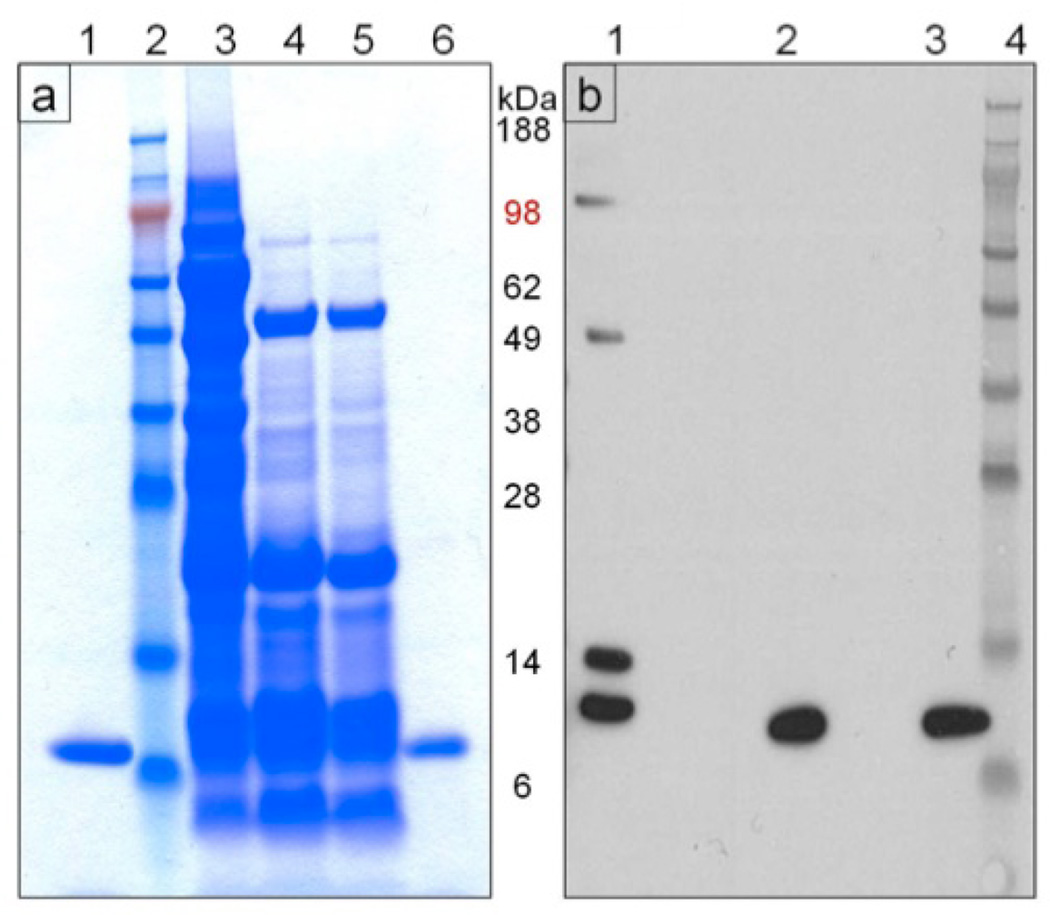
Figure 4.
Analysis of the rCV-N purification process. (a) Coomassie Blue-stained SDS-PAGE (reducing conditions) of fractions from the purification procedure. Lanes marked as 1: pure, active CV-N produced in E. coli (positive control), 2: SeeBlue Plus2 (Invitrogen) molecular weight standard, 3: total soluble protein, 4: supernatant from 67% ethanol precipitation, 5: resuspended pellet from 50% ethanol precipitation, and 6: pure rCV-N isolated in fraction 38 from reverse phase-HPLC. (b) Western blot (reducing conditions) for detection of CV-N in selected fractions from the purification. Lanes marked as 1: total soluble protein, 2: pure rCV-N isolated in fraction 38 from reverse phase-HPLC, 3: pure CV-N produced in E. coli (positive control) and 4: SeeBlue Plus2 (Invitrogen) molecular weight standard.

