
Figure 7. Inhibition of caveolae-mediated rLOX-PP-Atto565 and CtxB-Alexa647 uptake by siRNA knockdown of the primary caveolae protein caveolin-1.
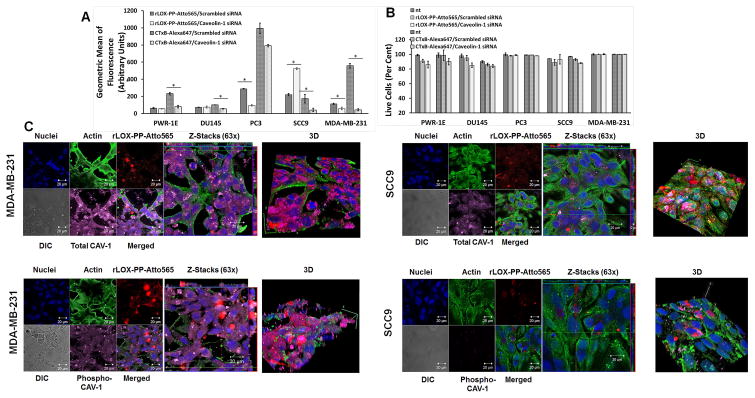
(A) After transfection, cells were serum starved for 12 hours followed by incubation with or without rLOX-PP-Atto565 or CtxB-Alexa647 for an additional 3 hours. rLOX-PP-Atto565 (solid gray and white) and CtxB-Alexa 647 (dashed gray and white) uptake were quantified by flow cytometry with (white) and without of CAV-1 knockdown (gray); Data are means +/− SD, n = 3.; *, two-tailed p-value < 0.005 (B) The LIVE/DEAD® Fixable Near-IR stain assay was employed to determine the percentage of live cells in each sample. (NT, dark solid or dashed gray bars; non-treated control cells; rLOX-PP-Atto565 or CtxB-Alexa647, solid or dashed light gray bars; rLOX-PP-Atto565 or CtxB-Alexa647 + caveolin-1 siRNA knockdown, solid or dashed light white bars). Data are means +/− SD, n = 3. (C) MDA-MB-231(left) and SCC9 cells (right) were transfected with either caveolin-1 siRNA or control siRNA. 60 hours after transfection, cells were serum starved for 12 hours followed by incubation with or without rLOX-PP-Atto565 (red) for an additional 15 min on ice, and then incubated at 37° C for 15 minutes in the 5% CO 2 incubator. Cells then were fixed, permeabilized and stained for F-actin (green), DNA (blue) and total caveolin-1(magenta) or phospho caveolin-1 (magenta). Merged Z-series images with rLOX-PP-Atto565 (above) and without rLOX-PP-Atto565 (below) treatment were reconstructed with Zen Black Edition software. 3D images were constructed with Image J software.