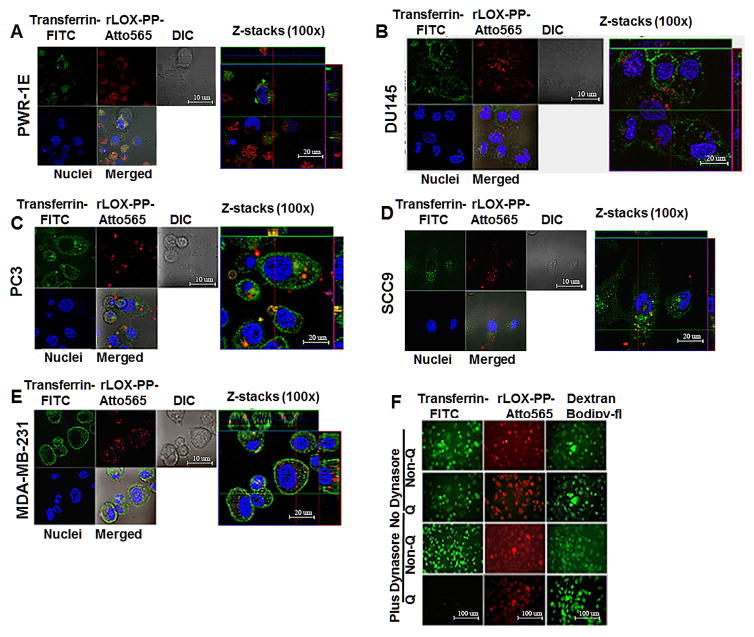
Figure 9. Co-localization of rLOX-PP-Atto565 and transferrin-FITC in various cell lines and inhibition of rLOX-PP-Atto565 (A–E), and 10 kDa dextran-Bodipy-fl and transferrin-FITC uptake in presence or absence of dynasore in PC3 cells at 3 hours (F).
Cells were incubated with FITC-transferrin (green) and rLOX-PP-Atto565 (red) for 15 minutes on ice, and then 30 minutes at 37°C before imaging. Nuclei were stained with Hoechst 33342 (blue). Confocal microscope images were formatted in split Z-stacks on the left and merged on the right for each cell lines. PWR-1E (A), DU145 (B), PC3 (C), SCC9 (D) and MDA-MC-231(E) cell lines were listed. Dichromatic (DIC) images are also shown. Transferrin (green) and rLOX-PP-Atto565 (red) co-localization was observed only in PC3 cells and confirms that rLOX-PP-Atto565 enters the PC3 cells through a clathrin-mediated pathway. In (F), uptake of transferrin-FITC was assessed after 30 minutes, while that of rLOX-PP-Atto565 and 10 kDa dextran-Bodipy-fl were assessed after three hours, in the presence or absence of dynasore in PC3 cells with or without quenching of extracellular fluorescence using a Zeiss Axiovert 100M inverted fluorescence microscope.

