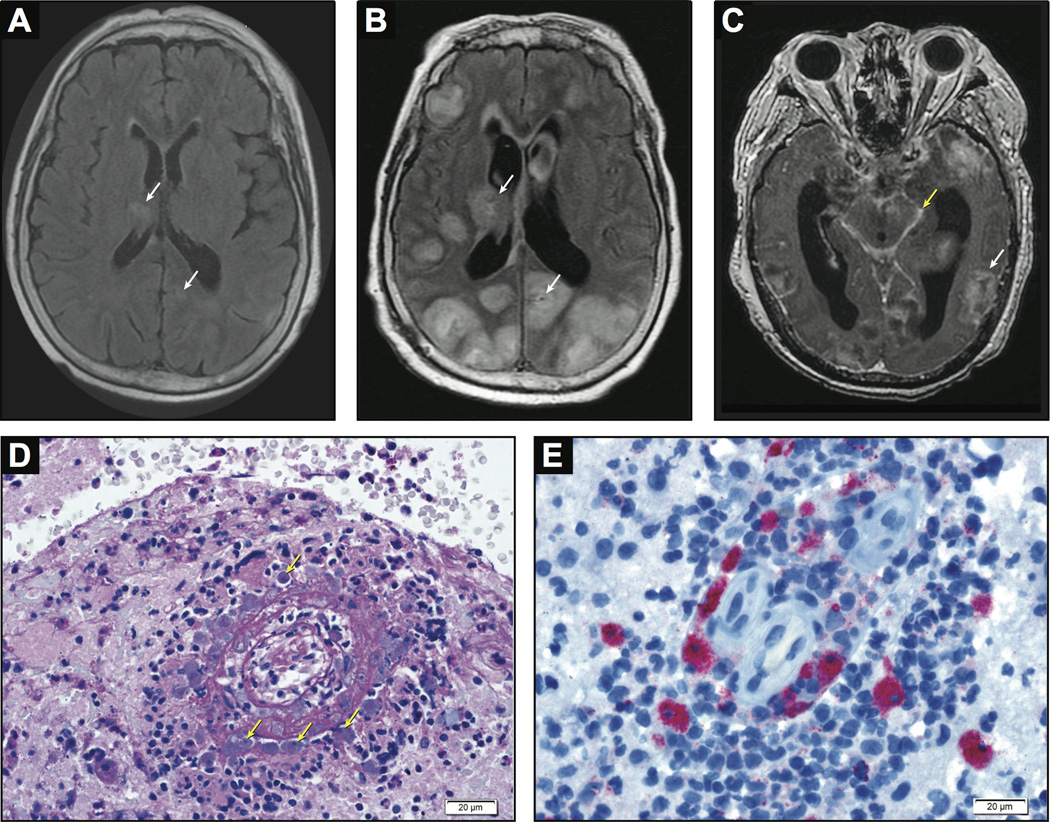
Figure 1. Neuroimaging and Neuropathology.
A, Axial T2-weighted / fluid attenuated inversion recovery (FLAIR) brain magnetic resonance imaging (MRI) demonstrating multiple hyperintensities (arrows) which correspond to areas of restricted diffusion on diffusion weighted imaging (not shown). B, Axial T2-weighted / FLAIR brain MRI demonstrating progression in the size and number of hyperintensities (arrows) visualized in the MRI in panel A. C, Post-contrast axial T1-weighted brain MRI demonstrating multiple ring enhancing lesions (white arrow) and basilar meningitis (yellow arrow) as well as severe hydrocephalus. D, Periodic acid-Schiff stained section of brain parenchyma shows necrotizing vasculitis, chronic inflammatory cells, and a population of amoebic trophozoites that closely resemble macrophages (arrows), 400×. The majority of the tissue showed a robust necrotizing vasculitis with mixed inflammation including macrophages and numerous eosinophils. E, Immunohistochemistry for free-living amoebas highlights numerous B. mandrillaris trophozoites, 400× (courtesy of M.K.K., CDC).

