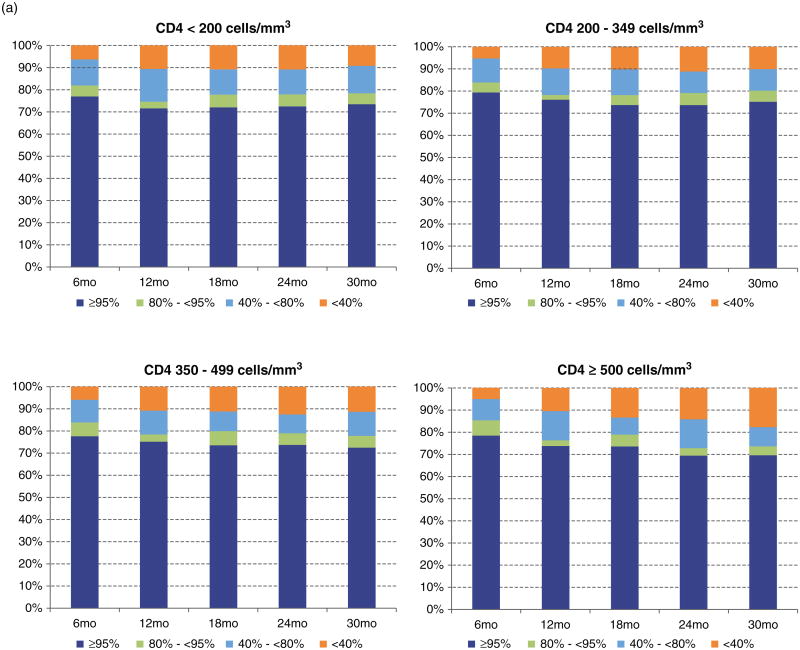
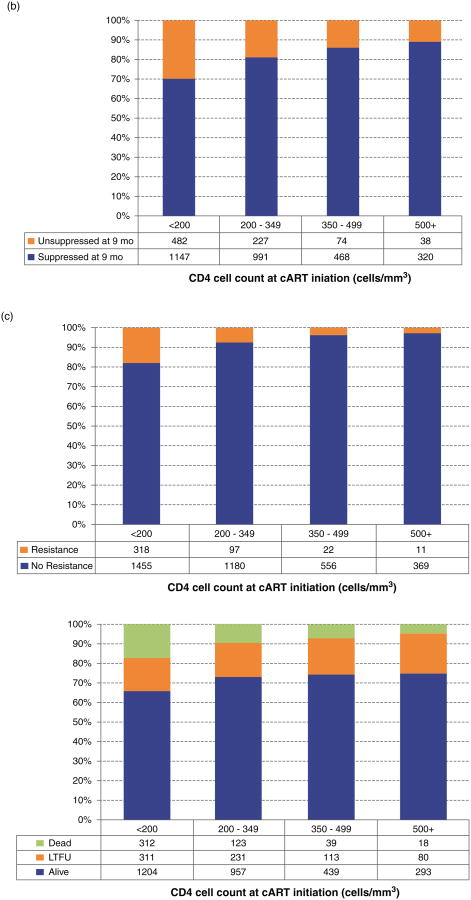
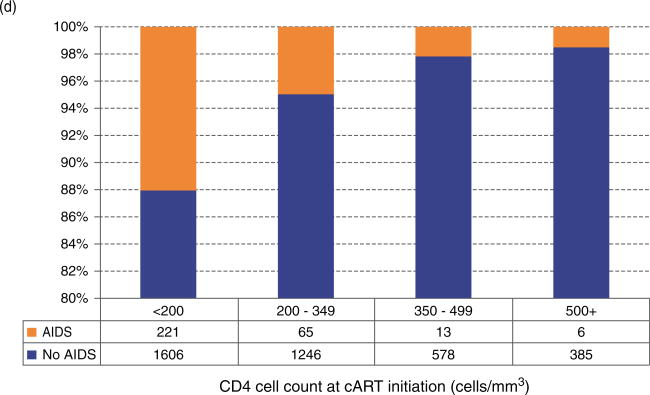
Fig. 1. Distribution of CD4+ at the start of combination antiretroviral therapy by different outcomes.
Stratified by: (a) adherence level over time; (b) achievement of suppression in 9 months after combination antiretroviral therapy initiation; (c) the emergence of resistance to any antiretroviral class during follow-up; (d) LTFU: lost to follow-up; (e) The emergence of an AIDS-defining illness during follow-up.


