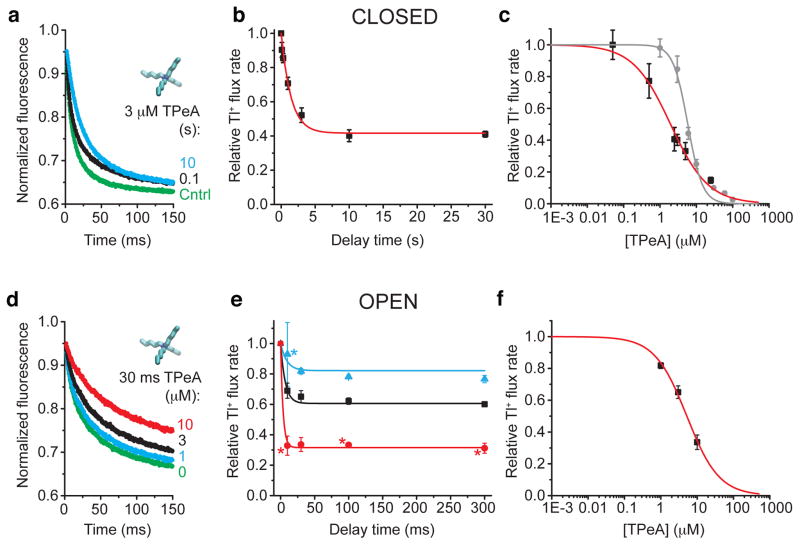
Figure 3. TPeA blocks closed and open MthK.
(a) Fluorescence quench traces after closed state incubation with 3 μM TPeA for 0.1 (black), 10 s (cyan), and no blocker control (green) (average of 4–7 repeats). (b) Relative Tl+ flux rates versus incubation time from data as in a. Red line is a fit with eq. 10 and 11 (τeq = 1.6 ± 0.2 s, KDclosed = 2.1 ± 0.2 μM, konclosed = 0.14 ± 0.02 μM−1 s−1). (c) Dose-response curve for closed state TPeA equilibrium block after 10 s blocker incubation. Red line is a Hill equation fit (eq. 12, KDclosed = 2.0 ± 0.2, nH = 0.84 ± 0.08). Dose response curve for open state block after the 2 ms mixing time (grey circles). The grey line has no theoretical meaning. (d) Fluorescence quench traces after 30 ms incubation with 17.2 mM Ca2+ to measure open state block by 0 (green), 1 (cyan), 3 (black) or 10 μM (red) TPeA (average of 4–7 repeats). (e) Relative Tl+ flux rates versus incubation time with open MthK for three [TPeA], colored as in d. The results were simultaneously fit to Eq. 11 (lines; KDclosed = 4.6 ± 0.2 μM, konclosed = 20 ± 3 μM−1 s−1). (f) Dose-response curve for TPeA binding to open MthK after 30 ms incubation with blocker (results from e) was fit by the Hill equation (red line; KDopen = 5.2 ± 0.3 μM, nH = 0.98 ± 0.07). Mean ± s.d. from at least three independent samples, except for experiments marked (*) in e, where n=2.

