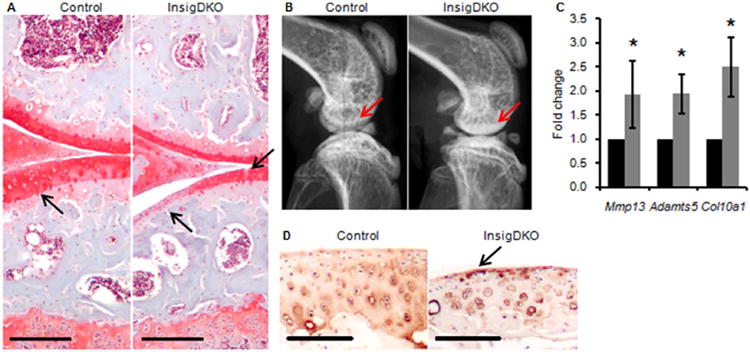
Figure 3. Intracellular cholesterol accumulation in chondrocytes induces osteoarthritic changes.

(A) Representative histological sections of mouse knees showing Safranin-O staining for proteoglycan at 6 months. Arrows point to loss of proteoglycan (red) and cartilage defects in InsigDKO. Scale bar, 100 μm. (B) Representative radiographic images of mouse knees showing a lateral view at 4 months. Arrows point to areas of subchondral sclerosis (whitening) in InsigDKO. (C) Real-time PCR of osteoarthritis markers in cartilage microdissected from mouse knees at 6 months. Expression of Control (black bars) was arbitrarily defined as ‘1’, and data for InsigDKO (grey bars) given as the mean. Error bars are 95% confidence intervals (n = 4, *P < 0.05). (D) Representative histological sections showing Col10a1 immunohistochemistry in the articular cartilage of the femur at 6 months. Arrow points to increased staining (brown) of hypertrophic chondrocytes in InsigDKO. Scale bar, 100 μm.
