
Fig. 10.
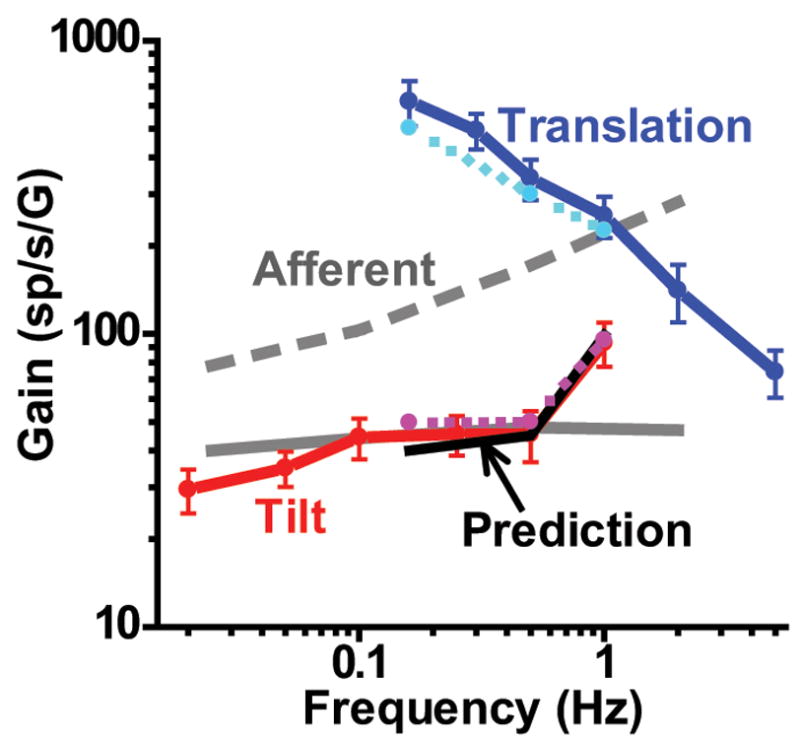
Comparison between response gain during tilt and translation as a function of frequency. Gain has been expressed relative to linear acceleration. Data are shown from two different experiments: those matching translation and tilt (0.16-1 Hz, cyan and magenta dashed lines, respectively) and those testing translation or tilt separately (solid blue and red lines, respectively). Black solid line illustrates the vectorial difference between translation (otolith-driven response) and tilt-translation (canal-driven response) gains (computed from the 0.16-1 Hz data only). Solid and dashed gray lines illustrate the mean gains from regular and irregular otolith afferents (replotted from Fernandez and Goldberg 1976).