
Fig. 2.
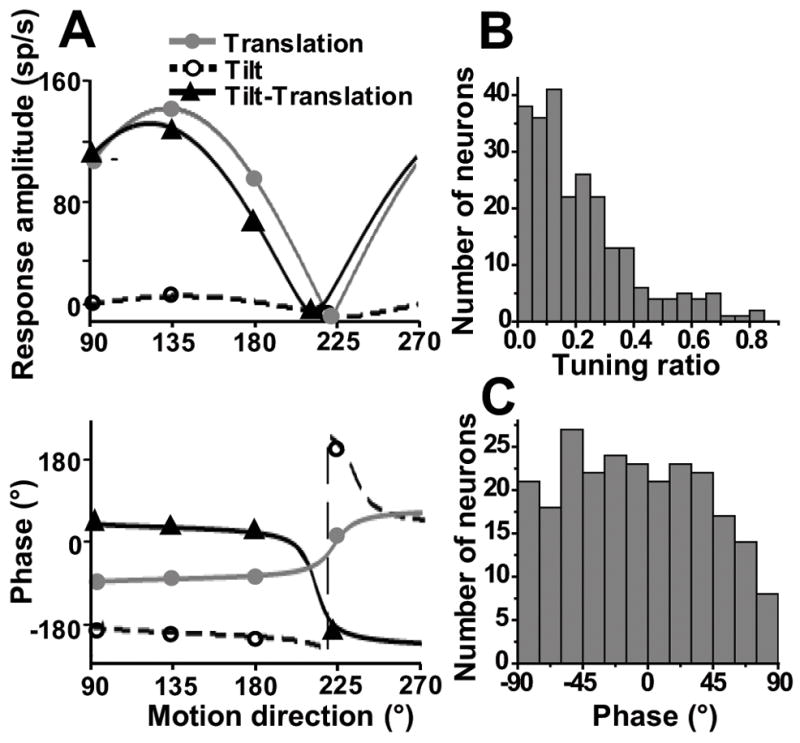
SS response properties during translation in the horizontal plane. (A) Peak response amplitude (top) and phase (bottom) of the cell of Fig. 1 during translation (otolith activation alone, gray circles/solid lines), tilt (activation of both otolith and semicircular canals, open circles/dashed lines) and tilt-translation (semicircular canal activation alone, black triangles/solid lines), plotted versus motion direction. Phase is expressed relative to linear acceleration (translation) or angular velocity (tilt and tilt-translation). Notice that translation and tilt-translation responses are aligned not only spatially but also temporally: translation phase lags linear acceleration by ~90°, illustrating responses in phase with velocity (tilt-translation phase slightly leads velocity). (B) Distribution of tuning ratio (0.5 Hz, n=243). (C) Distribution of response phase along the preferred direction in the horizontal plane (0.5 Hz, n=243).