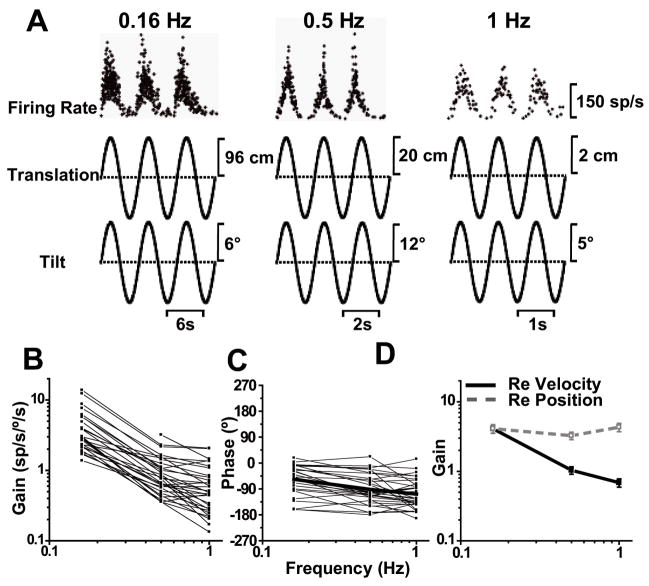
Fig. 7.
SS dynamics during tilt-translation. (A) Sinusoidal responses of a typical Purkinje cell tested during combinations of pitch tilt and fore-aft translation at 0.16, 0.5 and 1 Hz. (B, C) show the frequency dependence of response gain and phase (expressed relative to angular velocity), plotted separately for individual neurons (n=33). (D) Average neural response gain plotted versus frequency, where gain is computed either relative to angular velocity (filled symbols, black solid line) or relative to position (open symbols, gray dashed line).

